
Domestic market for distributed wind turbines faces several challenges
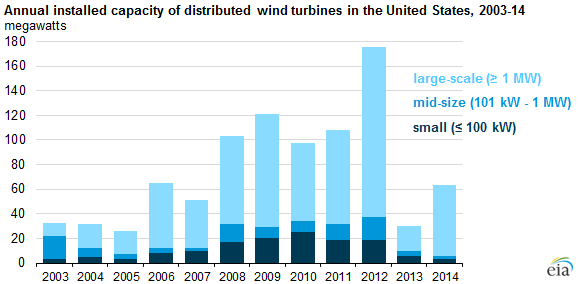
The domestic market for distributed wind turbines has weakened since the record capacity additions in 2012. Last year's installations of mid-size and small wind turbines were the lowest in a decade. Relatively low electricity prices, competition from other distributed energy sources, and relatively high permitting and other nonmaterial costs have presented challenges to the distributed wind market in the United States.
Most distributed wind turbines installed in 2014 were connected directly to distribution lines to serve local loads. Distributed wind turbines can also be installed either off-grid or grid-connected at local sites to offset all or a portion of a site's electricity consumption. Compared with electric utility wind facilities, distributed wind turbine installations are often smaller units, below 1 megawatt (MW), and thus may not appear on EIA's survey of utility-scale electric generators, which has a 1-MW threshold at the project level. Although some large-scale turbines (1 MW or greater) are used in distributed generation applications, large-scale turbines are more often used at wind farms for wholesale power generation, which is sent through transmission lines to more distant customers.
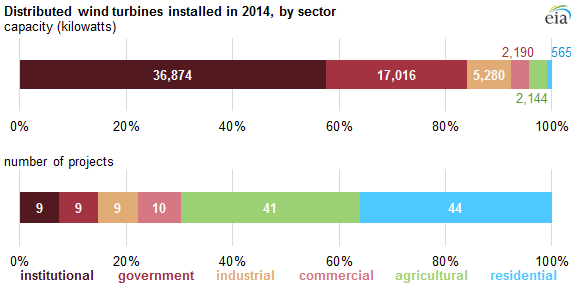
Based on information in the U.S. Department of Energy's Distributed Wind Market Report, most of the 2014 distributed wind capacity was installed on institutional sites, such as schools, universities, and electric cooperatives. Government installations on city, municipal, or military facilities made up more than one quarter of 2014 installed capacity. Other sectors (industrial, commercial, agricultural, and residential) were relatively small in terms of capacity, but larger in terms of number of installations, as the average turbine size on these sites is relatively small compared with institutional and government sites.
Some customers who install these turbines are eligible for federal tax credits, in particular the investment tax credit (ITC), which provides a 30% cost incentive for turbines with capacities of 100 kilowatts or less. The investment tax credit was one of the largest factors in both the increase in installations from 2010 to 2012 and the decline after 2012. In 2009, as part of the American Recovery and Reinvestment Act, the U.S. Treasury allowed projects to receive cash payments instead of tax credits. To qualify, projects had to be under construction or in service by the end of 2011 and must have applied for a grant by October 1, 2012.
Even though these tax credits are still available, the expiration of the cash payment option drastically reduced the installation of small and mid-size wind turbines. Further affecting the outlook for distributed wind is the U.S. Internal Revenue Service requirement, added this year, that small wind turbines meet performance and safety standards in order to qualify for the ITC.
Other factors cited in the recent decline in distributed wind installations are the relatively low price of grid electricity and lower cost of solar photovoltaic systems, which also receive the 30% ITC. Nonhardware costs associated with distributed wind, such as permitting, financing, installation, and supply chain costs, have not fallen as much as they have for solar photovoltaics. U.S.-based manufacturers and supply-chain vendors in the distributed wind market have been vulnerable to market downturns, preventing the market from growing at a faster rate. For these reasons, U.S.-based manufacturers may look to international opportunities, particularly in Japan and South Korea, to find more favorable markets.
Principal contributor: Owen Comstock
Tags: capacity, electricity, generation, wind