
More power generation came from natural gas in first half of 2020 than first half of 2019
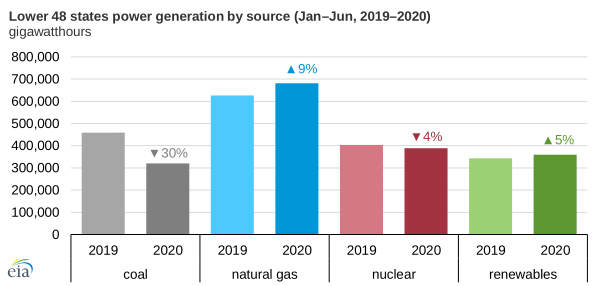
Natural gas-fired generation in the Lower 48 states increased nearly 55,000 gigawatthours (GWh), or 9%, in the first half of 2020 compared with the first half of 2019. Natural gas was the fastest-growing source of electric power generation, according to data from the U.S. Energy Information Administration’s (EIA) Hourly Electric Grid Monitor. The increase in natural gas-fired generation was the result of recent low prices and natural gas-fired power capacity additions, despite a 5% decline in total electricity generation. The decrease in electricity consumption resulted from reduced business activity as a result of COVID-19 mitigation efforts. Natural gas-fired generation from electric power plants reached record-high levels on July 28 as summertime heat began reaching its seasonal peak.
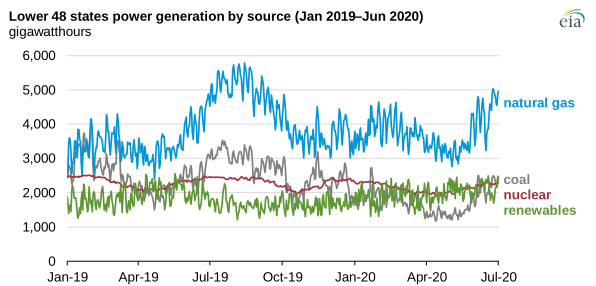
Coal-fired generation absorbed most of the decrease in electrical load in the first half of 2020, registering a 138,000 GWh (30%) decline in output. Because of historically low natural gas prices so far in 2020, coal-fired generation this year has been uneconomical in most regions compared with natural gas-fired generation, leading to price-driven coal-to-natural gas fuel switching. The monthly Henry Hub natural gas spot price, a national benchmark for U.S. wholesale prices, averaged $1.81 per million British thermal units (MMBtu) through the first half of the year, compared with an average of $2.74/MMBtu in the first half of 2019, and averaged $1.63/MMBtu in June 2020. Coal prices were relatively more stable in the first half of 2020; the average delivered cost of coal was $1.91/MMBtu this year through May compared with an average delivered cost of $2.07/MMBtu at the same time last year.
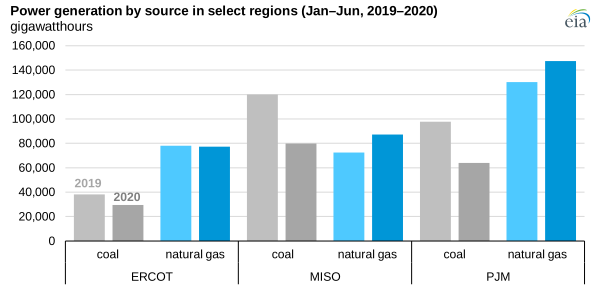
Coal-to-natural gas switching was most prominent in the PJM Interconnection (PJM), which covers an area stretching from New Jersey to Illinois, and the Midcontinent Independent System Operator (MISO), which primarily includes areas in the Midwest. PJM and MISO together account for about 35% of the total Lower 48 states’ electric power generation. In both interconnections, competition exists between natural gas and coal as generation fuels, so relative shifts in fuel prices can influence the type of power plant that is dispatched. By the end of June, the natural gas spot prices at the Tetco M3 hub in eastern Pennsylvania and the Chicago Citygate fell to $1.58/MMBtu and $1.66/MMBtu, respectively, down nearly 50¢/MMBtu each from last year. As prices fell, natural gas-fired generation increased by about 17,000 GWh in PJM and 15,000 GWh in MISO in the first half of 2020, while coal-fired generation declined about 34,000 GWh in PJM and 40,000 GWh in MISO.
In the Electric Reliability Council of Texas (ERCOT), which generates about 10% of total power generation in the Lower 48 states, declines in coal-fired generation were not offset by increases in natural gas-fired generation like in PJM and MISO. Despite coal-fired generation declining 8,650 GWh in the first half of 2020 compared with the first half of 2019, natural gas-fired generation also declined slightly. Instead, most of the decline in coal-fired generation was offset by increases in wind and solar generation, which together increased about 8,400 GWh in the first half of 2020. In addition, coal-fired generation remains reasonably competitive in ERCOT because power plants have access to low-cost subbituminous coal from Wyoming’s Powder River Basin and to lignite—the lowest quality of coal—produced at mines near several plants.
Capacity additions have also contributed to the growth in natural gas-fired generation. According to the Electric Power Monthly, about 18,000 megawatts (MW) of net capacity from new combined-cycle natural gas turbine plants has entered service since 2018. Output from these highly efficient plants has been steadily ramping up and helping to drive increases in generation. During the same 30-month period (January 2018–June 2020), about 31,000 MW of net capacity for coal-fired plants retired along with about 2,400 MW in net capacity for nuclear power plants.
Natural gas-fired generation is facing increased competition from solar and wind capacity. Since 2018, about 23,200 MW of new net solar and wind capacity has been added. Renewable energy, consisting of wind, solar, and hydroelectric generation, has increased by about 5% and has been the only other fuel source other than natural gas to grow in the first half of 2020.
Principal contributors: Stephen York, Mark Morey
Tags: generation, coal, electricity, natural gas, nuclear, renewables