
China surpassed the United States as the world’s largest crude oil importer in 2017
From December 17 through December 31, Today in Energy will feature a selection of our favorite articles from 2018. Today’s article was originally published on February 5.
Note: December U.S. imports derived from weekly crude oil imports.
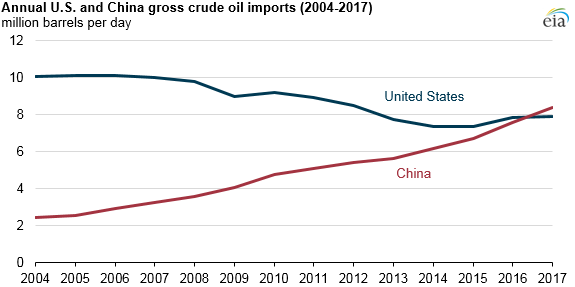
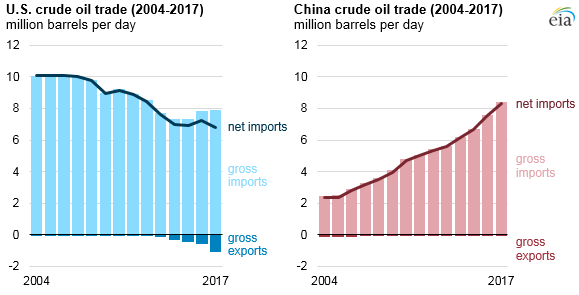
China surpassed the United States in annual gross crude oil imports in 2017, importing 8.4 million barrels per day (b/d) compared with 7.9 million b/d for the United States. China had become the world’s largest net importer (imports minus exports) of total petroleum and other liquid fuels in 2013. New refinery capacity and strategic inventory stockpiling combined with declining domestic oil production were the major factors contributing to the recent increase in China’s crude oil imports.
Note: December U.S. imports derived from weekly crude oil imports.
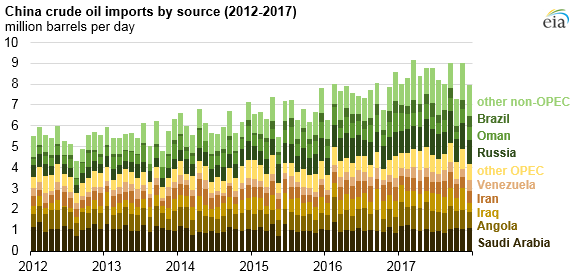
In 2017, 56% of China’s crude oil imports came from countries within the Organization of the Petroleum Exporting Countries (OPEC), a decline from the peak of 67% in 2012. More so than other countries, Russia and Brazil increased their market shares of Chinese imports between those years from 9% to 14% and from 2% to 5%, respectively.
Russia surpassed Saudi Arabia as China’s largest source of foreign crude oil in 2016, exporting 1.2 million b/d to China in 2017 compared with Saudi Arabia’s 1.0 million b/d. OPEC countries and some non-OPEC countries, including Russia, agreed to reduce crude oil production through the end of 2018, which may have allowed other countries to increase their market shares in China in 2017.
Several factors are driving the increase in China’s crude oil imports. China had the largest decline in domestic petroleum and other liquids production among non-OPEC countries in 2016, and EIA estimates it will have had the second-largest decline in 2017. Total liquids production in China averaged 4.8 million b/d in 2017, a year-over-year decline of 0.1 million b/d (2%) from 2016, and further declines in both 2018 and 2019 are forecasted in EIA’s January 2018 Short-Term Energy Outlook (STEO).
In contrast to declining domestic production, EIA estimates that growth in China's consumption of petroleum and other liquid fuels in 2017 was the world’s largest for the ninth consecutive year, growing 0.4 million b/d (3%) to 13.2 million b/d. As China has built up inventories of strategic petroleum reserves, China’s crude oil imports have increased faster than their domestic consumption.
In addition, China has reformed its refining sector by reducing restrictions on both imports and exports. Since mid-2015, China granted crude oil import licenses to independent refineries in northeast China, which have since increased refinery utilization and crude oil imports.
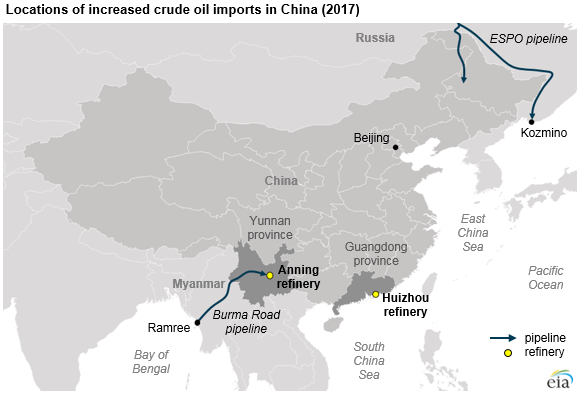
China’s crude oil imports have also increased because of higher refinery runs and expanding refinery capacity. China’s refinery runs increased by an estimated 0.5 million b/d in 2017 to 11.4 million b/d, driven in part by two refinery expansions in the second half of the year. A 260,000 b/d refinery in Anning in Yunnan province started operating in the third quarter of 2017. The China National Offshore Oil Corporation’s (CNOOC) Huizhou refinery increased capacity by 200,000 b/d and increased its imports from various sources in the third and fourth quarters of 2017.
Ongoing infrastructure expansions will likely contribute to further increases in China’s crude oil imports. In January 2018, China and Russia began operating an expansion of the East Siberia-Pacific Ocean (ESPO) pipeline, doubling its delivery capacity to approximately 0.6 million b/d. According to trade press reports, as much as 1.4 million b/d of new refinery capacity is planned to open in China by the end of 2019. Given China’s expected decline in domestic crude oil production, imports will likely continue to increase over at least the next two years.
Principal contributor: Jeff Barron
Tags: China, crude oil, exports/imports, international, liquid fuels, map