
U.S. natural gas production to reach record highs in 2026 and 2027
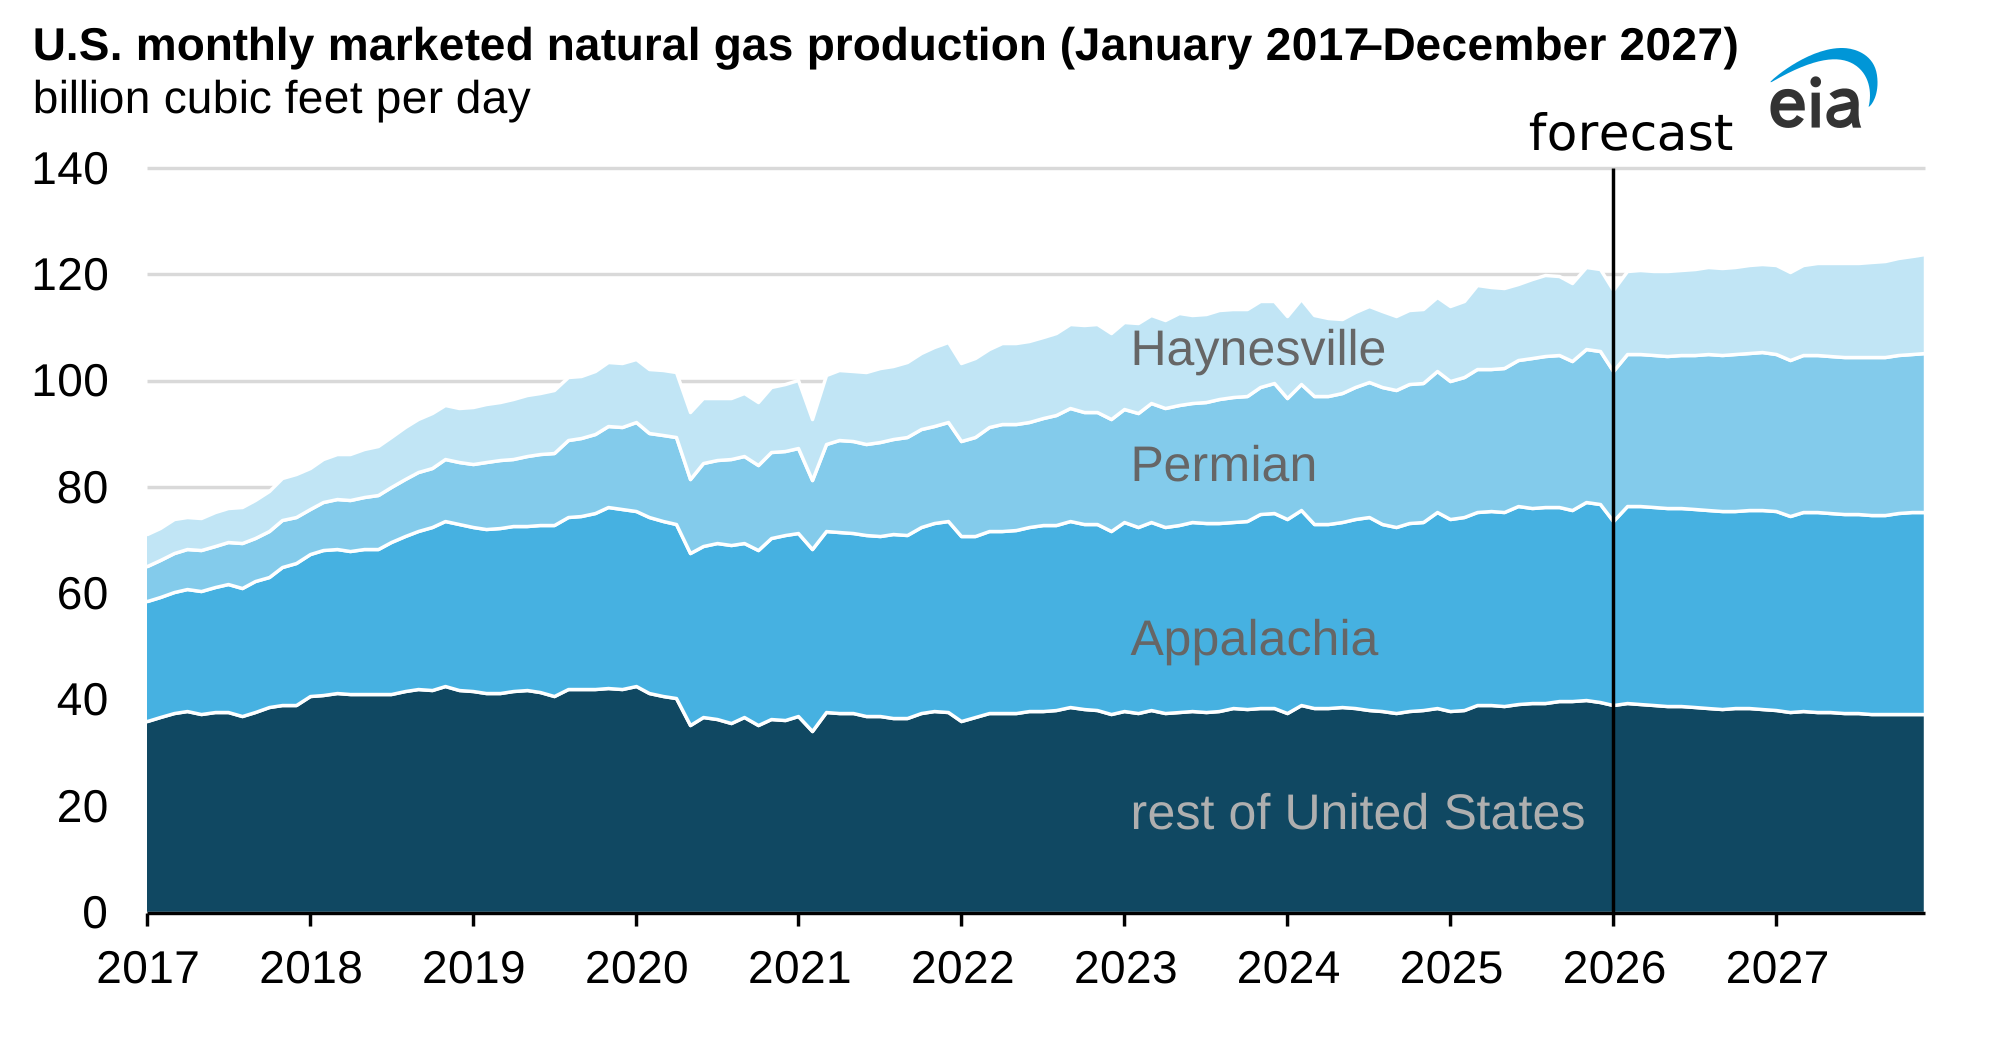
We forecast that U.S. natural gas marketed production will increase by 2% to average 120.8 billion cubic feet per day (Bcf/d) in 2026 and then further increase to a record-high 122.3 Bcf/d in 2027 in our latest Short-Term Energy Outlook (STEO). Around 69% of forecast production over the next two years comes from the Appalachia, Haynesville, and Permian regions.
U.S. natural gas production growth will primarily come from the Appalachia region in the Northeast, the Permian region in western Texas and southeastern New Mexico, and the Haynesville region in eastern Texas and Louisiana.
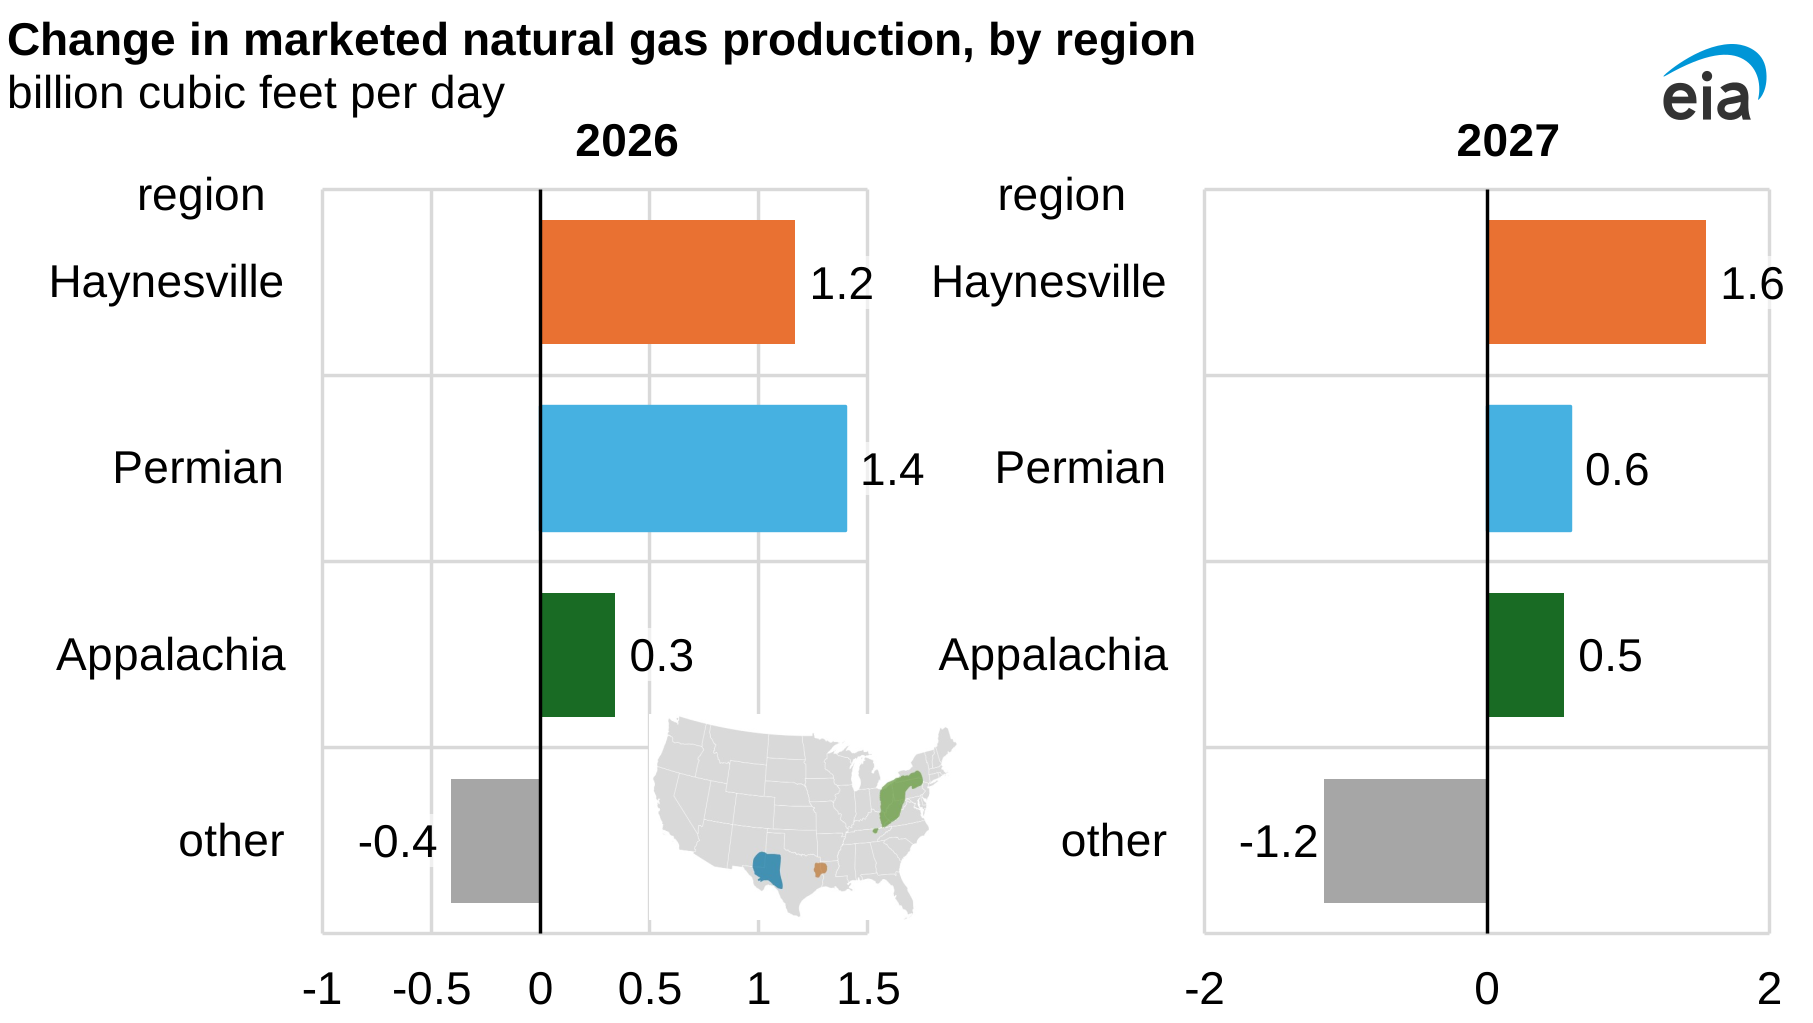
Forecast production from the Haynesville region grows by 1.2 Bcf/d in 2026 and then by 1.6 Bcf/d in 2027, as natural gas prices remain relatively elevated through the forecast period. We expect prices to rise from $3.52 per million British thermal units (MMBtu) in 2025 to $4.31/MMBtu in 2026 and to $4.38/MMBtu in 2027, which allows drilling in the Haynesville region to remain economical, even with relatively deeper and more expensive well development. In addition, the Haynesville’s proximity to liquefied natural gas (LNG) export terminals and major industrial natural gas consumers along the U.S. Gulf Coast draws operators to the region.
The Permian region contributes 1.4 Bcf/d to forecast production growth in 2026 and 0.6 Bcf/d in 2027. In the Permian region, growth in natural gas production is primarily the result of associated gas produced during oil production. We estimate that oil-directed rig activity in the Permian will be relatively low as West Texas Intermediate prices fall from $65/b in 2025 to average $53/b in 2026 and then average $49/b in 2027. Despite these lower prices, we estimate that increases in gas-to-oil ratio (GOR) will drive natural gas production growth in the Permian region. We expect the GOR to continue its steady increase in the Permian.
In recent years, the Appalachia region has provided the largest share of U.S. domestic natural gas output, accounting for around 32% of U.S. Lower 48 states production annually since 2016. Production growth has slowed in recent years because of pipeline capacity constraints. In June 2024, the Federal Energy Regulatory Commission authorized the Mountain Valley Pipeline to begin operations. With this new capacity addition, we estimate that Appalachian production will grow slightly by 0.3 Bcf/d in 2026 and then by 0.5 Bcf/d in 2027.
Principal contributor: Naser Ameen