
In-brief analysis
June 24, 2025
About one-fifth of global liquefied natural gas trade flows through the Strait of Hormuz
Data source: U.S. Energy Information Administration, World Bank, and Global Energy Monitor, Global Gas Infrastructure Tracker
Note: LNG=liquefied natural gas, FSRU=floating storage regasification unit
Note: LNG=liquefied natural gas, FSRU=floating storage regasification unit
- In 2024, about 20% of global liquefied natural gas (LNG) trade transited the Strait of Hormuz, primarily from Qatar. The strait is a critical route for oil and petroleum products as well.
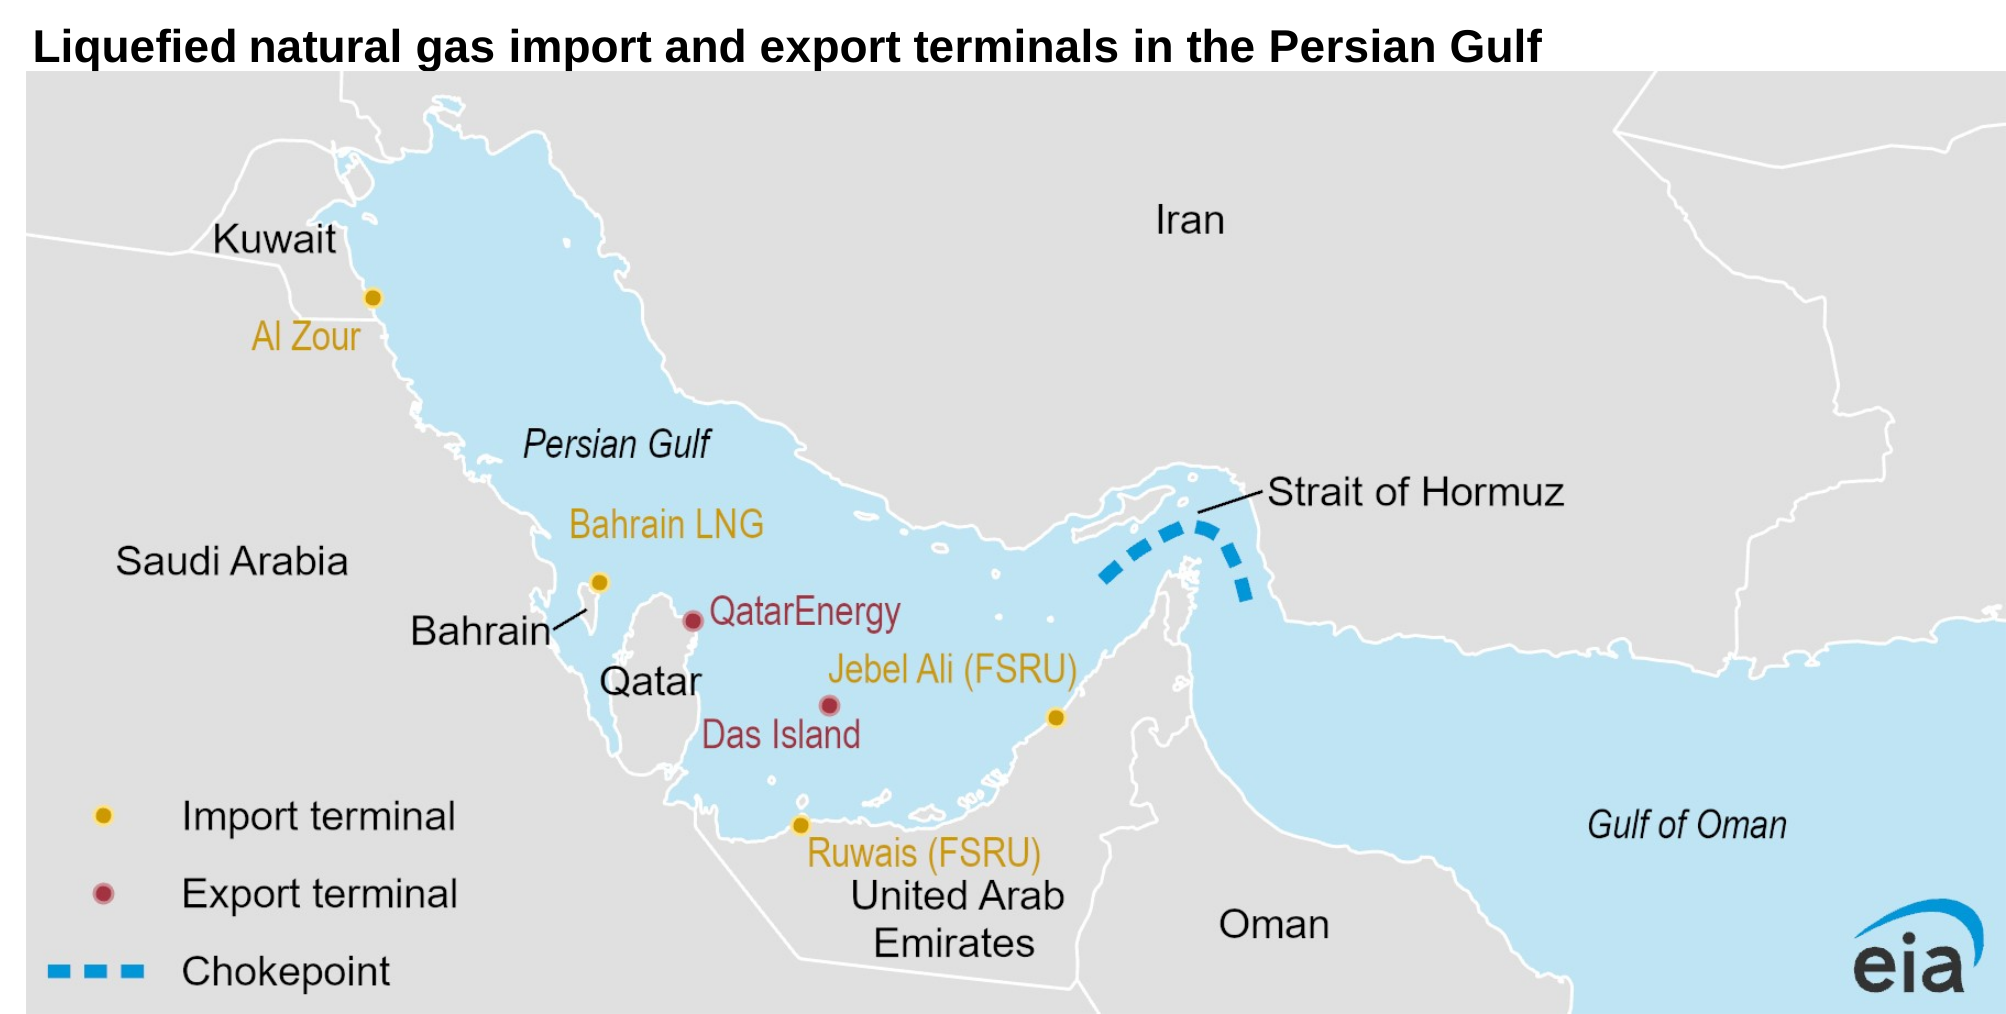
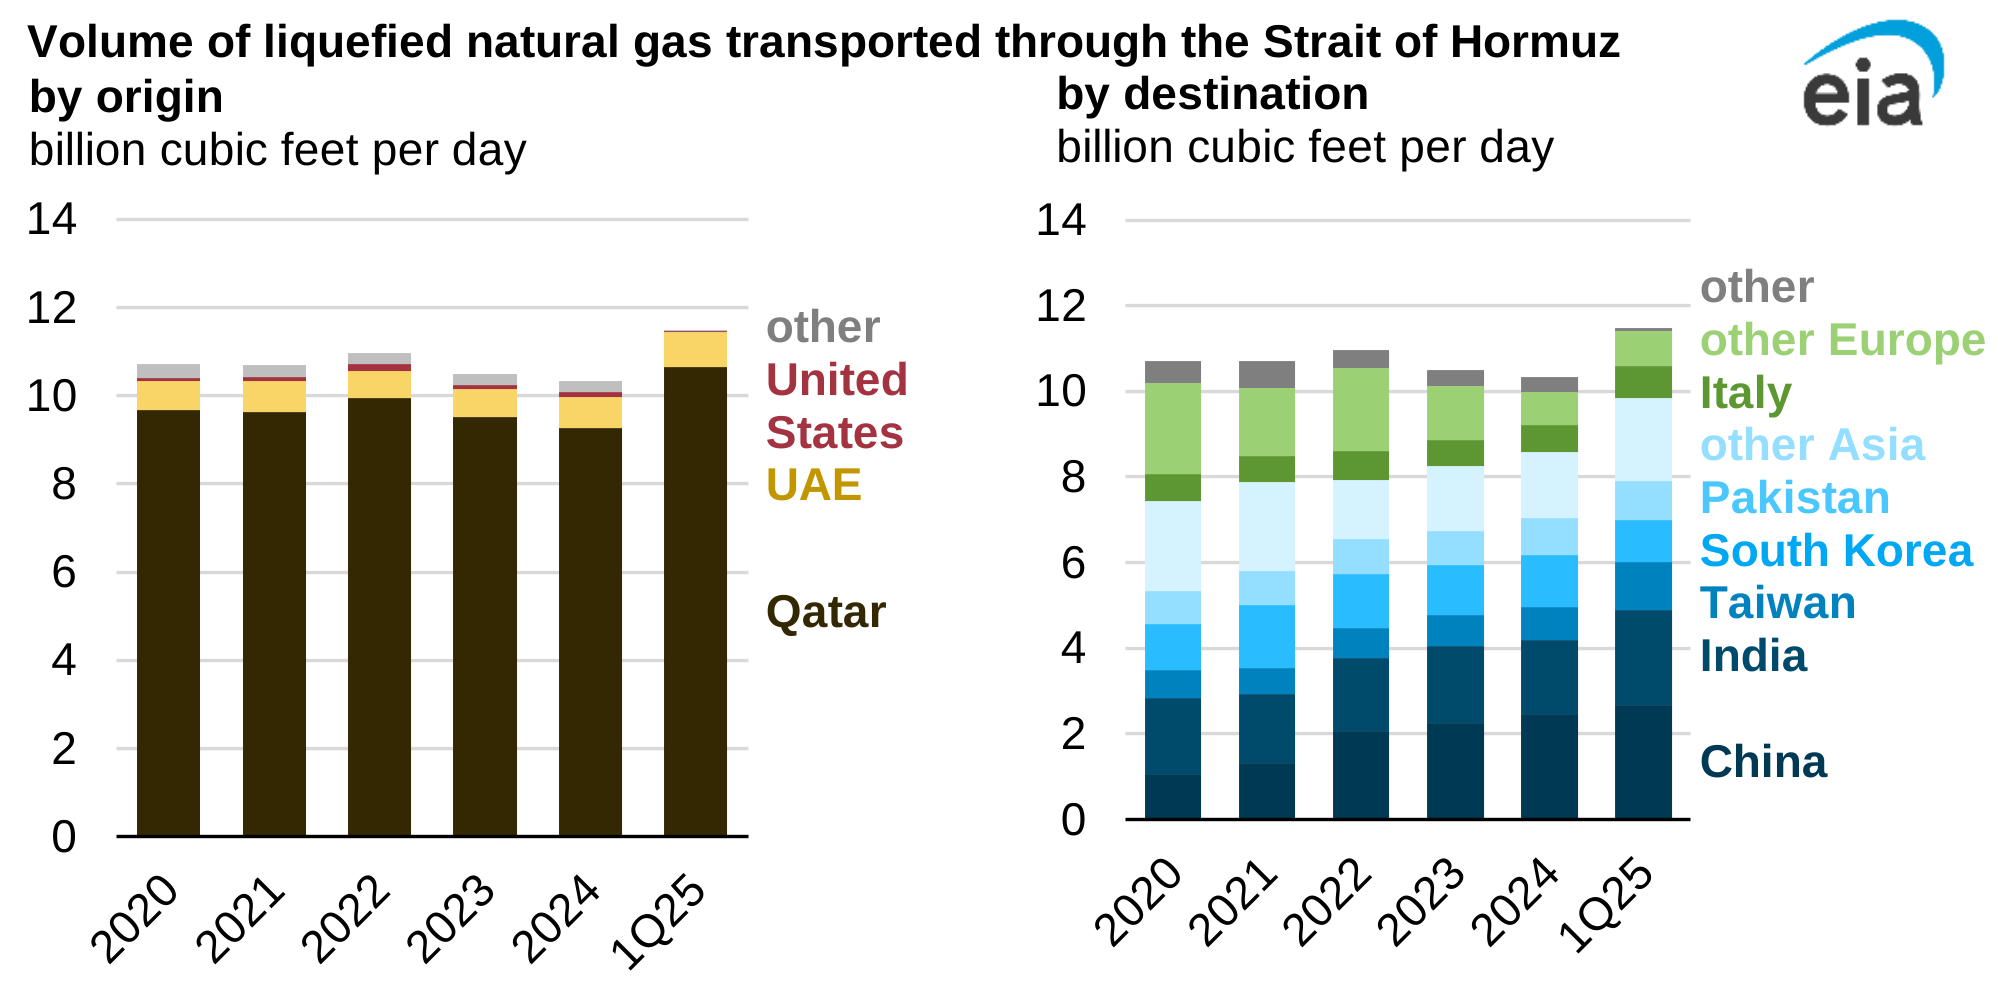
- Qatar exported about 9.3 billion cubic feet per day (Bcf/d) of LNG through the Strait of Hormuz in 2024, and the United Arab Emirates (UAE) exported about 0.7 Bcf/d, accounting for nearly all LNG flows from the Persian Gulf through Hormuz.
- We estimate that 83% of the LNG that moved through the Strait of Hormuz in 2024 went from Persian Gulf countries to Asian markets. China, India, and South Korea were the top destinations for LNG moving through the Strait of Hormuz, accounting for 52% of all Hormuz LNG flows in 2024. In 2024, disruptions to LNG flows through the Bab al-Mandeb Strait, which connects the Red Sea to the Gulf of Aden and Arabian Sea, and more U.S. LNG exports to Europe pushed LNG exports from Qatar away from Europe to Asia.
- Kuwait and the UAE imported LNG that originated outside of the Persian Gulf, including from the United States and West Africa. Bahrain began operating an LNG import terminal in April 2025 and also received cargoes that transited Hormuz from outside of the Persian Gulf, including recent cargoes in April and June that originated from the United States.
Data source: U.S. Energy Information Administration analysis based on Vortexa tanker tracking data
Note: 1Q25=first quarter of 2025. figure data
Note: 1Q25=first quarter of 2025. figure data
Principal contributors: Candace Dunn, Justine Barden