
Well completions per location more than double in Lower 48 states as technology advances
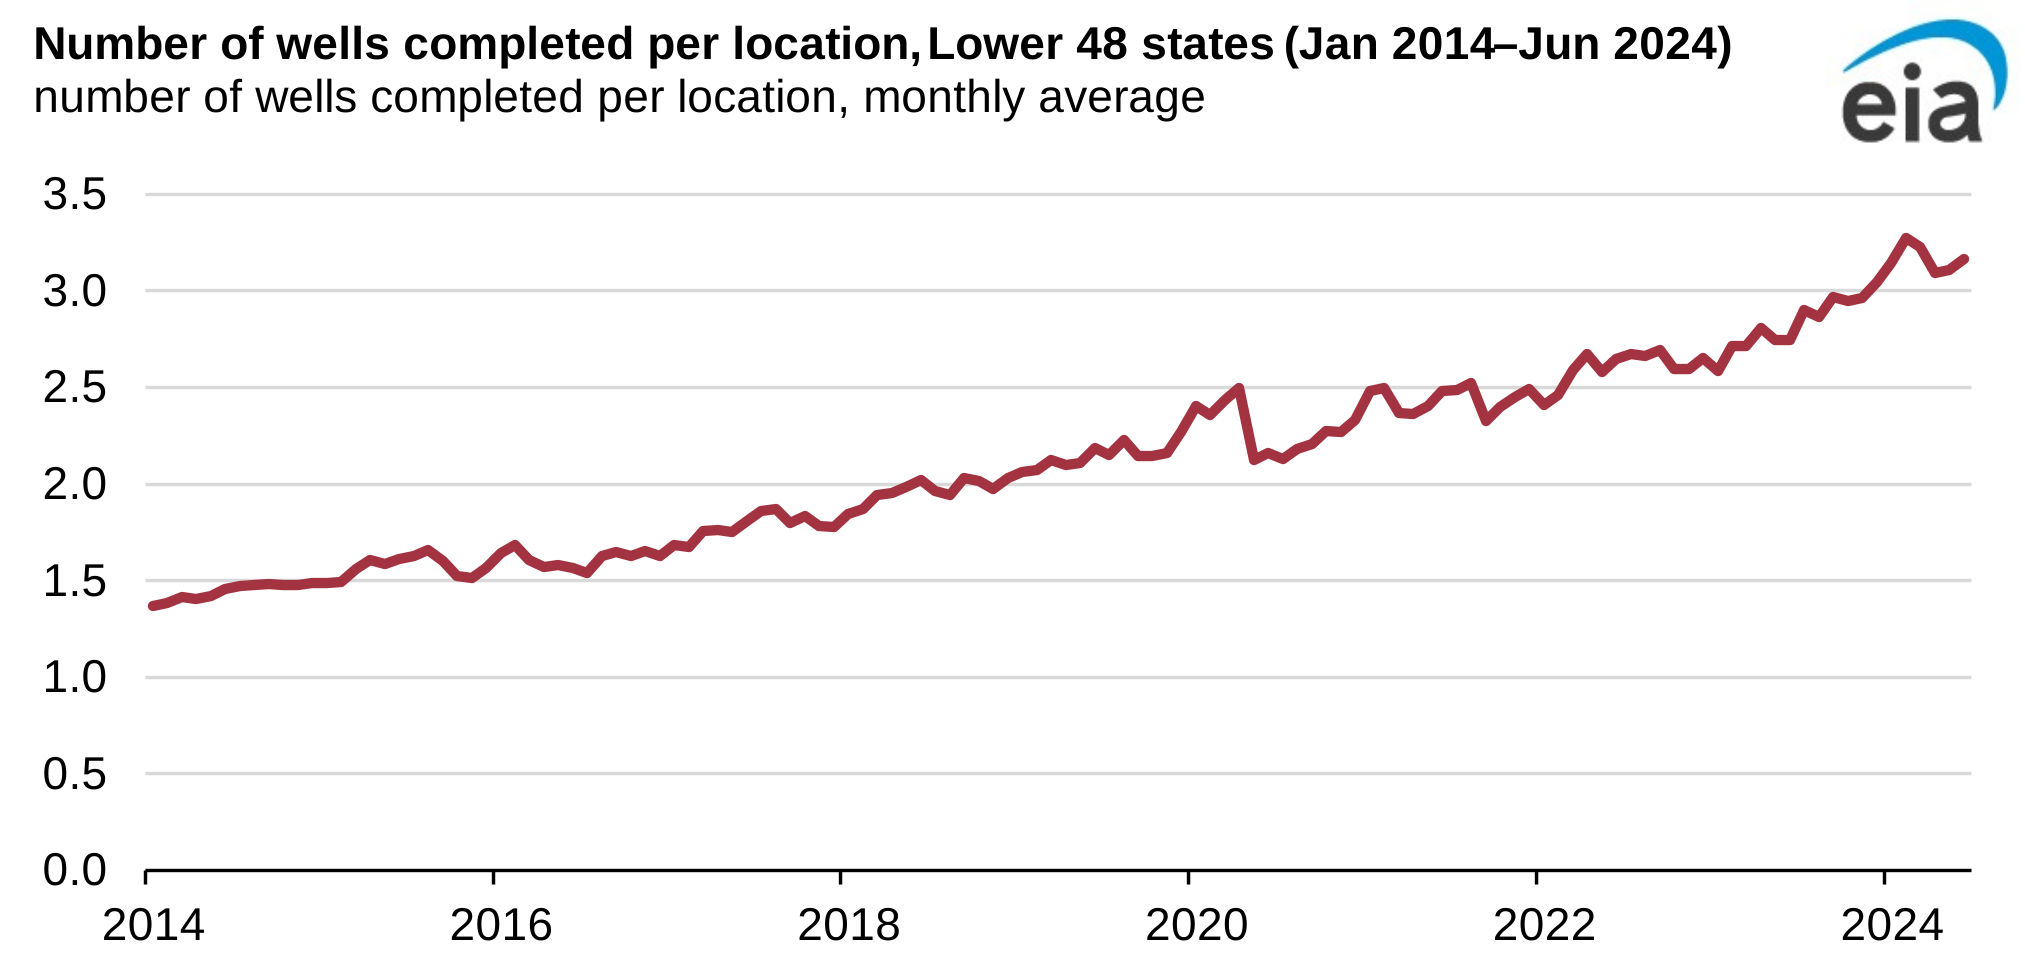
Note: To calculate the number of wells completed per location, we grouped wells within a 50-foot radius into single locations. We then identified wells completed by their completion start and end dates, counting concurrent completions when their completion periods overlapped.
We estimate that the average number of wells completed simultaneously at the same location in the Lower 48 states has more than doubled, increasing from 1.5 wells in December 2014 to more than 3.0 wells in June 2024. By completing multiple wells at once rather than sequentially, operators can accelerate their production timeline and reduce their cost per well. The increasing number of simultaneous completions reflects significant technological advances in hydraulic fracturing operations, particularly in equipment capabilities and operational strategies.
Using data from FracFocus to estimate simultaneous completions, we defined wells that were drilled within a 50-foot radius to be at a single location. FracFocus reports the well completion date for each of these wells, and we calculated the average number of completions per month. By grouping the wells together by location, we derived the number of wells completed on the same day at the same location across the Lower 48 states.
Simultaneous completions allow operators to reduce the time from post-drilling to production, lower overall completion costs per well, and increase operational efficiency through shared resources and equipment. Although the number of active locations has decreased since 2014, the number of wells has increased, likely because of simultaneous completions. Our analysis of FracFocus data suggests that simultaneous completions have increased since 2017, with operators now routinely completing multiple wells at a time on a single location. Although operators recognized the potential benefits of completing multiple wells at once prior to 2017, the practice initially faced technical barriers, such as the need for more hydraulic horsepower at the location to fracture multiple wells simultaneously.
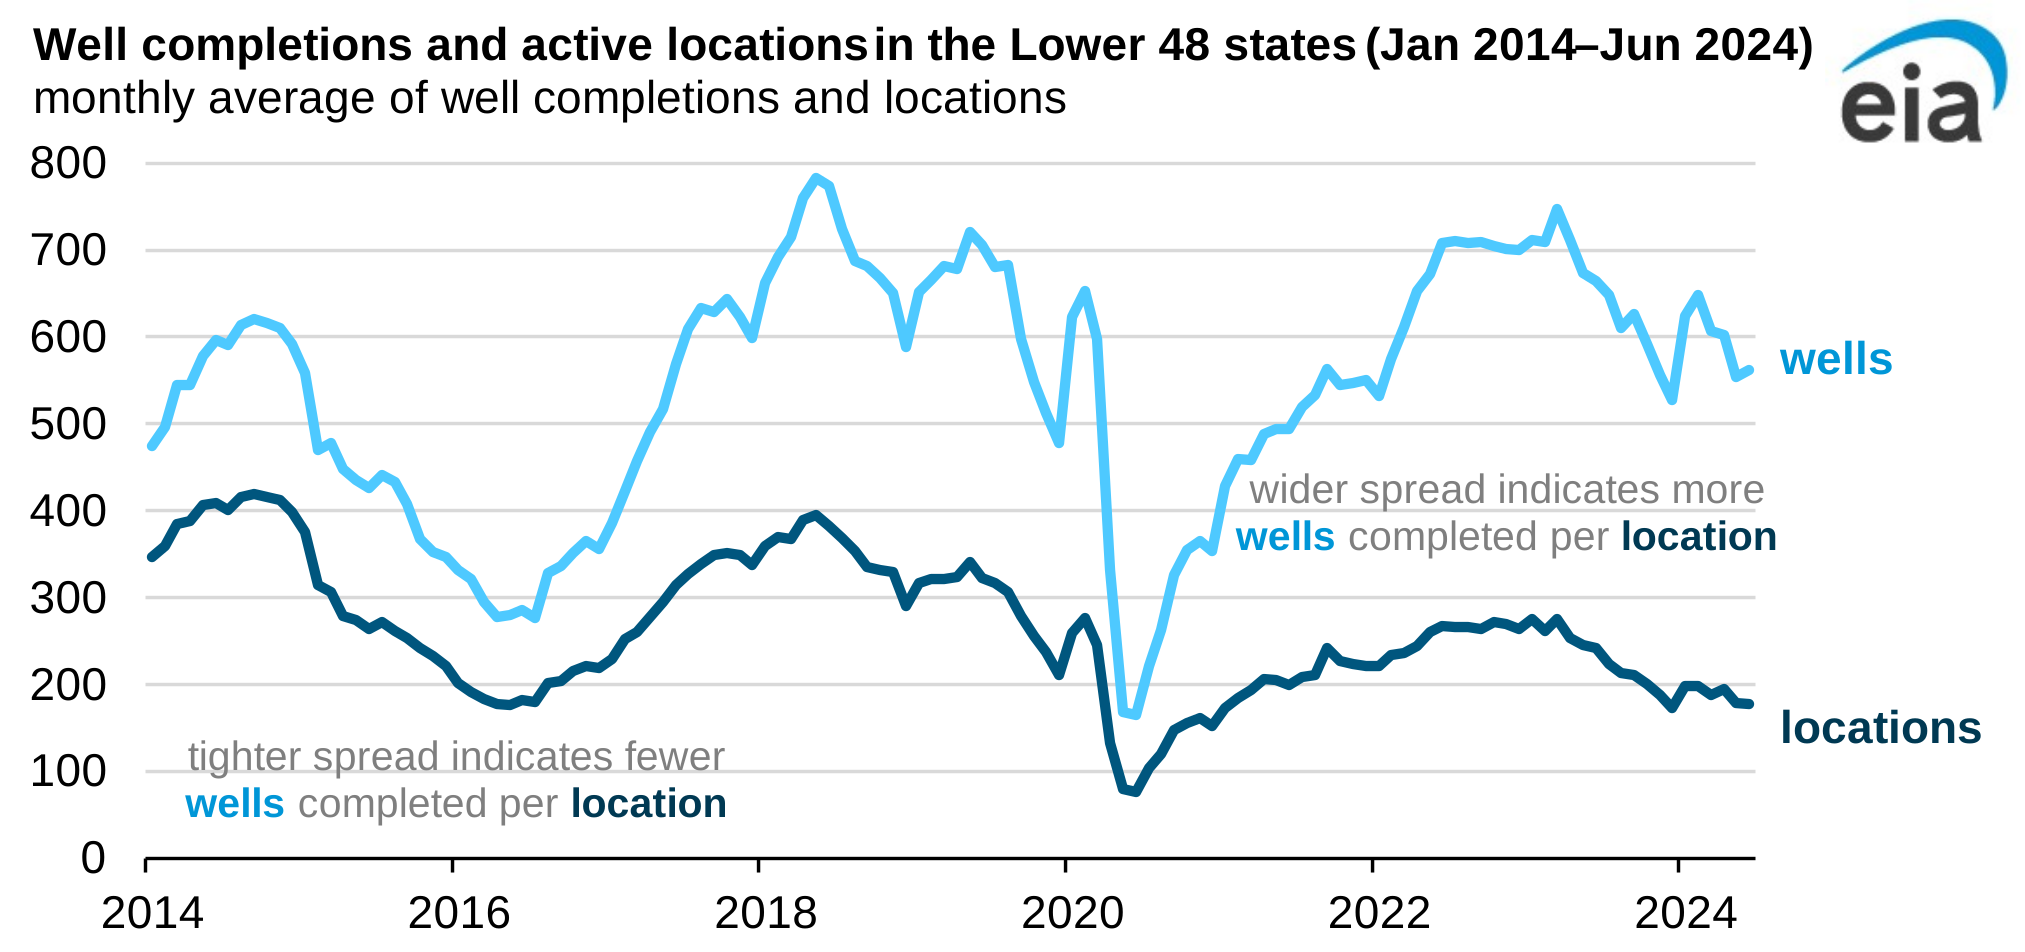
Note: We define locations as clusters of wells within a 50-foot radius. A single location may contain one or multiple wells.
The adoption of electric frac fleets, which provide better power management, has played a crucial role in the increase in simultaneous completions. Traditional operations relied entirely on diesel-powered pumps requiring constant fuel delivery by truck, but modern electric fleets use generators that can utilize field gas or compressed natural gas and electricity from the grid, if available.
The transition from diesel-powered to electric frac fleets has streamlined operations by reducing costs and minimizing transportation logistics by utilizing locally available fuel sources. Additionally, improvements in equipment monitoring, optimization, and automation have helped operators manage the complexity of simultaneous completions.
The trend toward more simultaneously completed wells continues to evolve as operators refine their simultaneous completion strategies. Although not all operators choose to perform simultaneous completions, the technology enabling these operations has become increasingly common across major shale basins. The penetration of electric frac fleets, advanced control systems, and improved process deployment suggests that simultaneous completions could continue to increase further.
Principal contributors: Faouzi Aloulou, Merek Roman, Jozef Lieskovsky
Tags: wells, drilling, production/supply