
Natural gas-fired electricity generation during Texas cold snap just shy of record high
Note: ERCOT=Electric Reliability Council of Texas; CT=central time
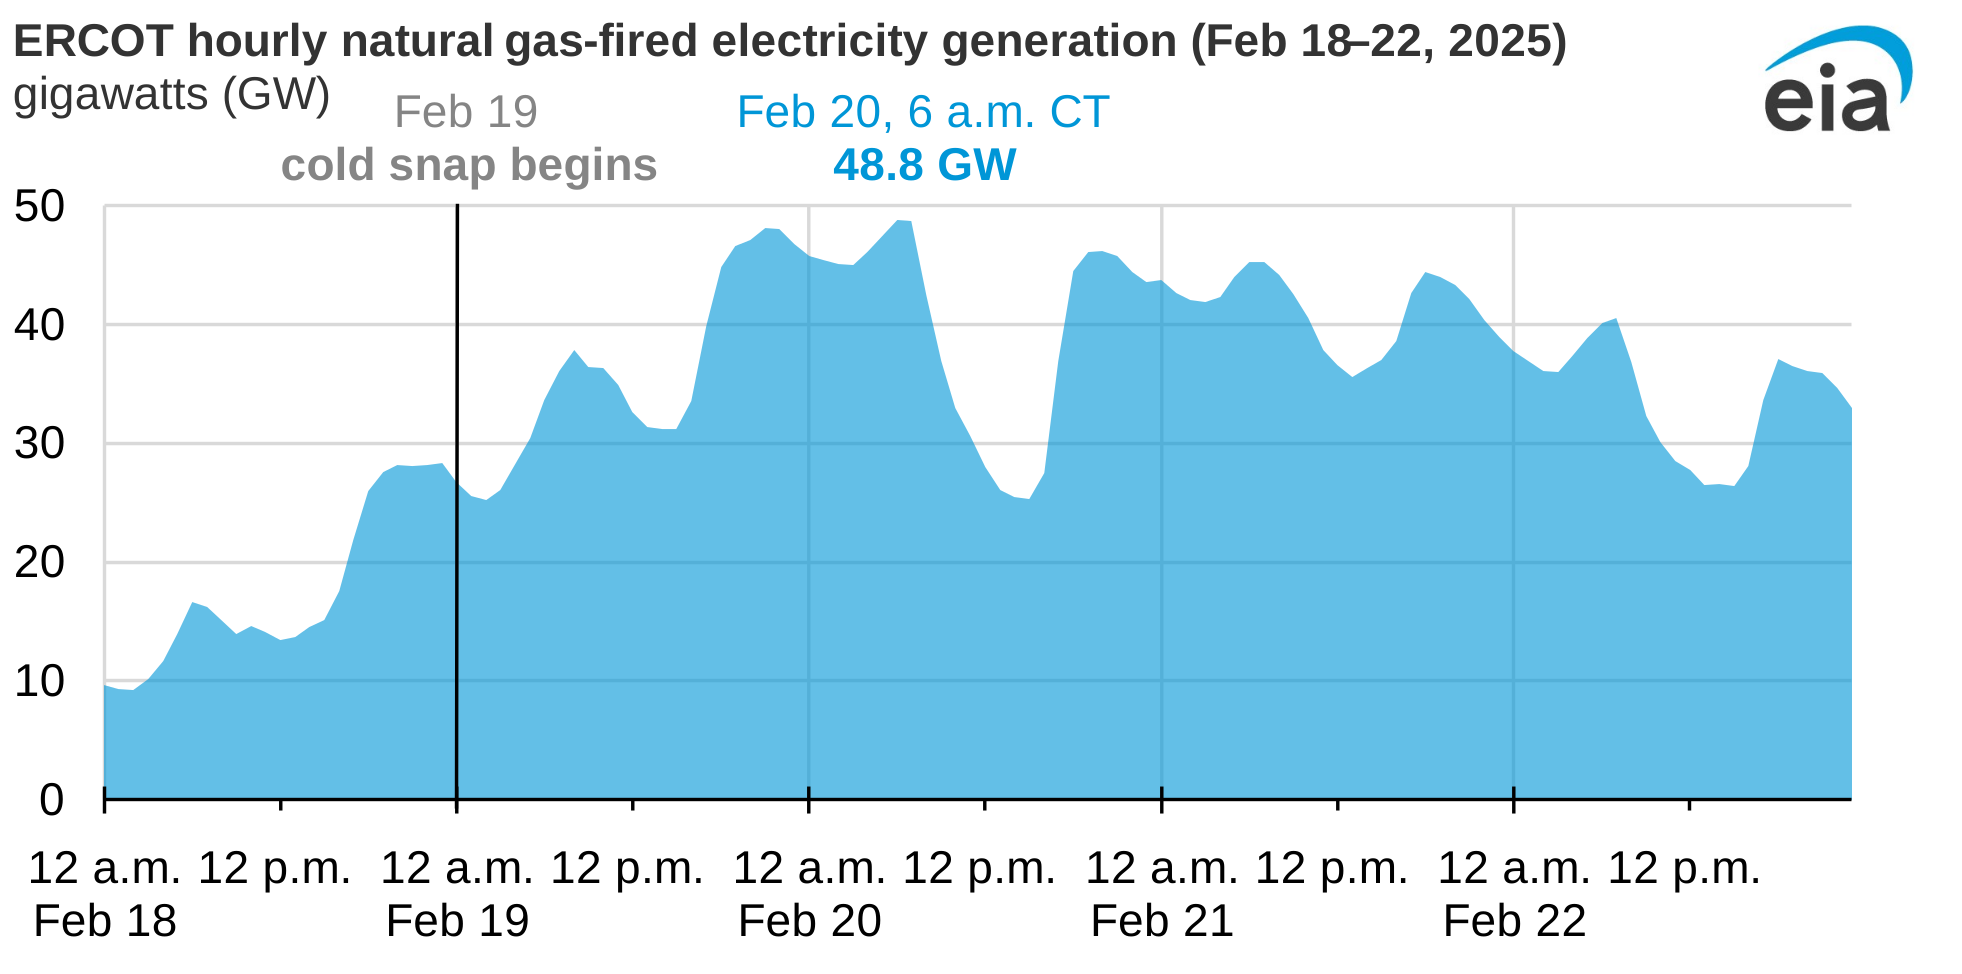
A February 19–22 cold snap increased electricity demand in Texas, and natural gas-fired electricity generation approached record highs for hourly and daily generation.
Electricity demand in Texas typically peaks in the summer during heat waves and in the winter during cold snaps. During peaks in electricity demand, grid operators must have dispatchable electricity generation sources available to service net electricity load, which is the generation required to meet demand after subtracting supply from intermittent sources such as wind and solar. Surges in electricity demand in the region overseen by the Electric Reliability Council of Texas (ERCOT) are primarily supplied by natural gas-fired generation; ERCOT manages approximately 90% of the electricity load in Texas. In addition to demand surges, natural gas-fired generation rises to meet supply requirements during periods of lower wind and solar generation. In February’s cold snap, demand increased and combined wind and solar generation decreased.
According to our Hourly Electric Grid Monitor, natural gas-fired electricity generation in the region increased to 48.8 gigawatts (GW) between 6:00 a.m. and 7:00 a.m. central time on February 20, 193% higher than the same time on February 18 (the day before the cold snap) and only 1% below the previous record set on January 16, 2024. Rising temperatures during the daylight hours on February 20 decreased electricity generation needs, which led to lower natural gas-fired generation during the daytime.
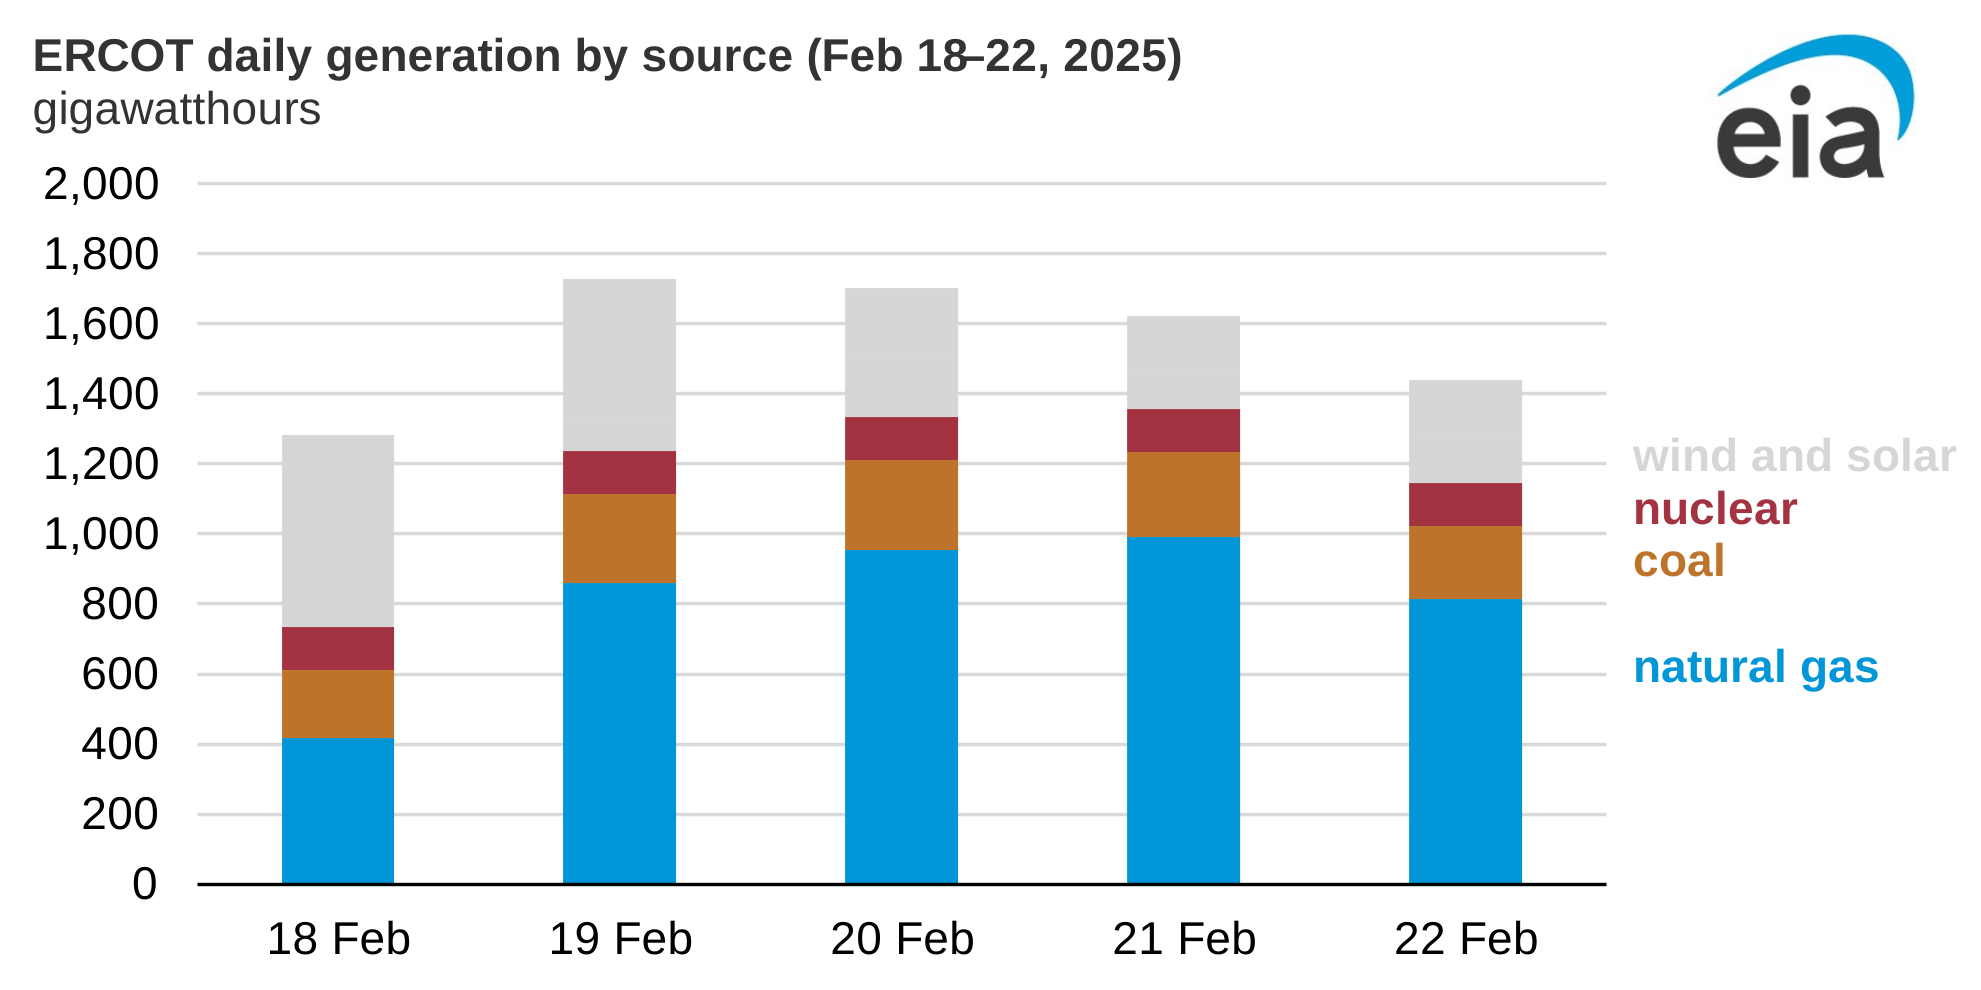
Although hourly natural gas generation peaked on February 20, daily natural gas-fired electricity generation peaked during the cold snap on February 21 at 991.9 gigawatthours (GWh). Natural gas generation on February 21 was the second-highest daily level ever recorded in ERCOT and 1% less than the previous record set on December 23, 2022, according to our Hourly Electric Grid Monitor. Average daily natural gas-fired generation during the cold snap was 904.8 GWh, 411.1 GWh (83%) more than the February 2025 daily average and 575.6 GWh (175%) higher than the same period in 2024.
Note: ERCOT=Electric Reliability Council of Texas
Daily net electricity load peaked at 1,357.4 GWh on February 21 (85% higher than on February 18), of which 73% was served by natural gas-fired generation. Natural gas met 95% of the increase in net electricity load between February 18 and 22. Wind and solar generation decreased to 264.2 GWh on February 21, 52% less than on February 18, increasing the demand for natural gas-fired electricity generation.
Although winter storms can disrupt production in the natural gas sector, supplies in Texas were sufficient during peak generation periods this February. System reliability was improved by weatherization standards approved in August 2022 following Winter Storm Uri in February 2021. The new standards required critical natural gas infrastructure, including pipelines servicing power plants, to be better protected against weather emergencies.
Principal contributor: Jordan Young
Tags: natural gas, electricity, generation, weather, states, Texas