
U.S. share of electric and hybrid vehicle sales reached a record in the third quarter
This TIE has been updated to reflect a data correction.
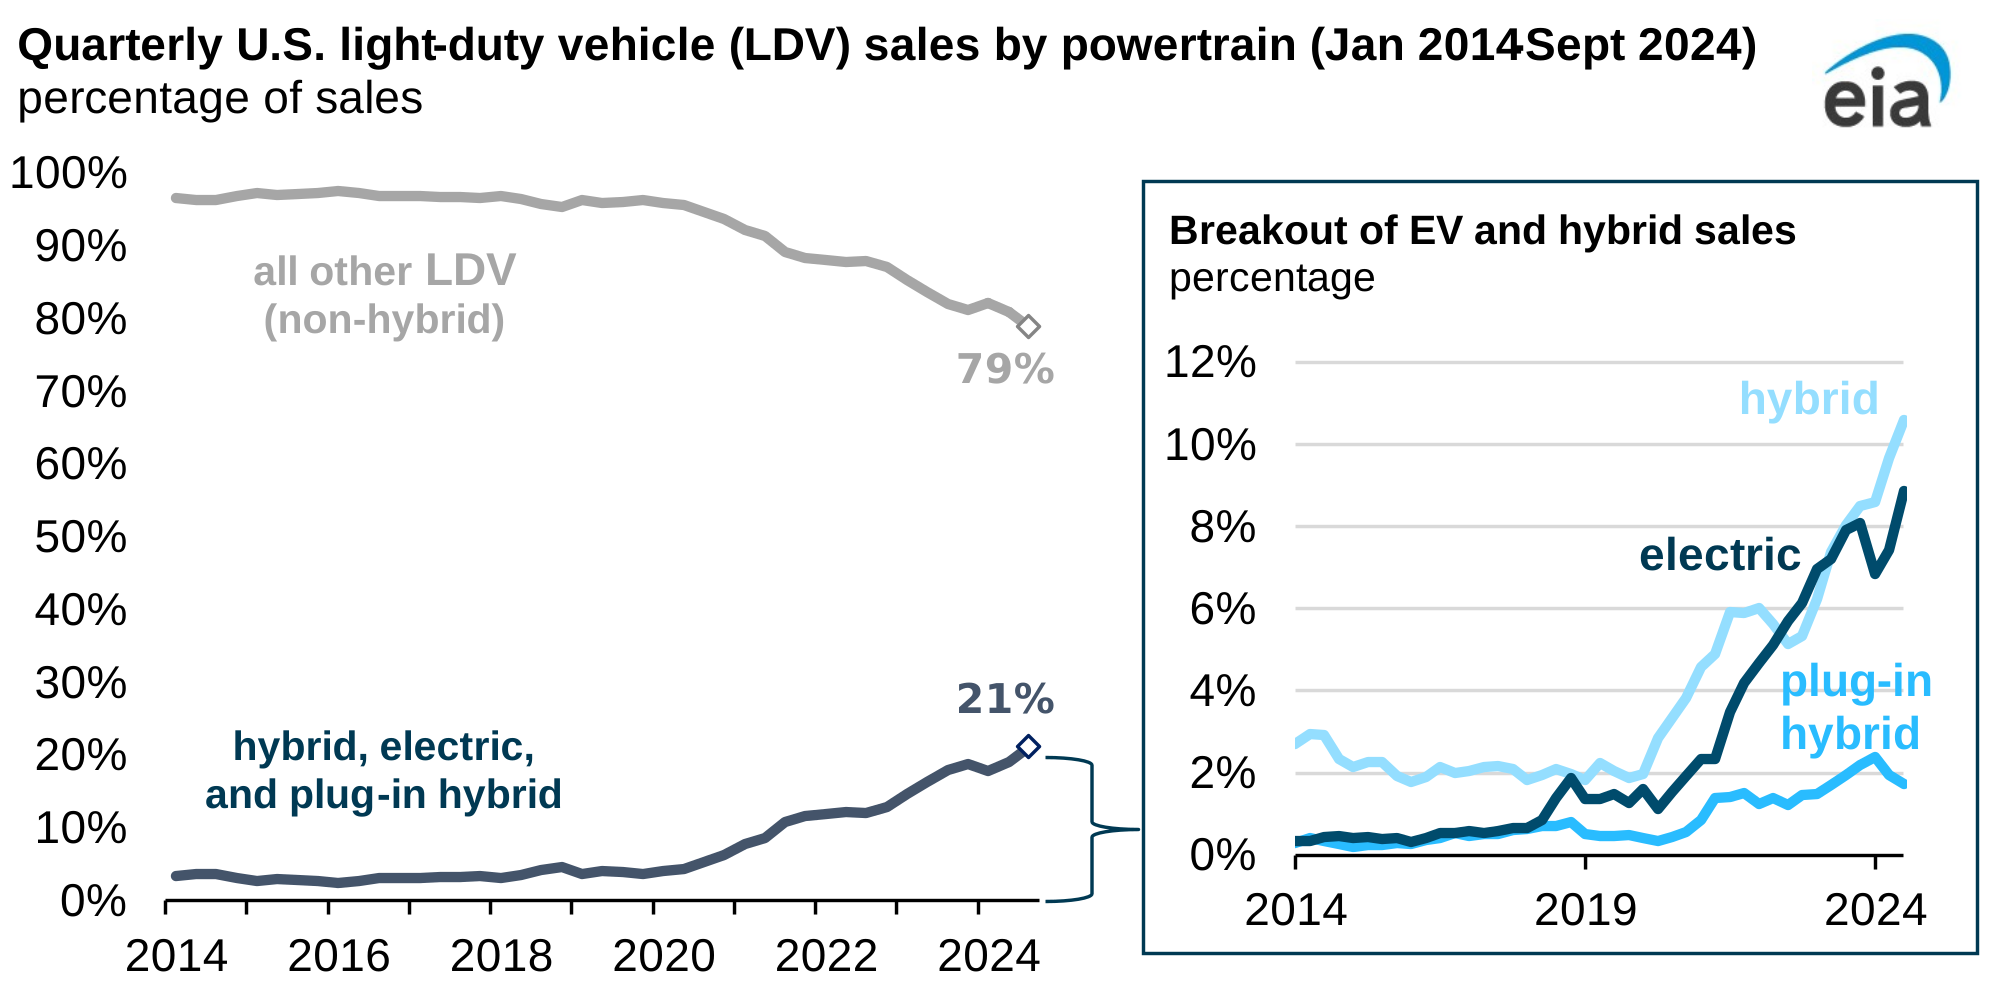
Note: EV=electric vehicles, including both battery electric and plug-in hybrid electric vehicles
The share of electric and hybrid vehicle sales in the United States increased again in the third quarter of 2024 (3Q24), reaching a record. Combined sales of hybrid vehicles, plug-in hybrid electric vehicles, and battery electric vehicles (BEVs) increased from 19.1% of total new light-duty vehicle (LDV) sales in the United States in 2Q24 to 21.2% in 3Q24, according to estimates from Wards Intelligence.
This increase in the electric and hybrid vehicle market share was driven primarily by BEV sales. BEV sales continue to increase, with the share growing from 7.4% of the U.S. LDV market in 2Q24 to 8.9% in 3Q24. The share of hybrid vehicle sales also increased, with hybrid vehicles making up 10.6% of the U.S. LDV market in 3Q24, a record.
BEVs continued to be popular in the luxury vehicle segment, accounting for 35.8% of U.S. LDV luxury sales in 3Q24. However, luxury BEVs as a share of total BEV sales have been decreasing as sales outside the luxury market have increased, falling to the lowest share since 2Q17. Still, 70.7% of BEVs sold in the United States during 3Q24 were luxury vehicles, while 10.3% of the hybrid vehicles sold were luxury. According to Cox Automotive, the average transaction price for a new BEV before accounting for any consumer or government incentives was $56,351 at the end of 3Q24, about 16% higher than the overall industry average price.
Tesla still holds the number one spot in the U.S. BEV market, although at 48.8%, its market share was less than 50% for a second consecutive quarter this year. Tesla’s Model Y and Model 3 continue to drive sales, and the recently released Tesla Cybertruck was a driving factor in Tesla’s increase in sales in 3Q24, outselling all its large truck competitors (Rivian R1S, Rivian R1T, Ford F150 Lightning, Chevy Silverado EV, Hummer EV, and GMC Sierra EV). Ford continued to hold the second-largest share of the BEV market, although that share shrunk to 6.9% in 3Q24 from 7.9% in 2Q24. Sales shifted to other manufactures such as Chevrolet, driven by sales of the newly introduced Equinox model and the continued success of the Blazer model. Chevrolet replaced Hyundai as the manufacturer with the third-largest share of the BEV market in 3Q24, with 5.8% of sales.
EV manufacturers are producing vehicles both domestically and globally. According to estimates from Wards Intelligence, 78.9% of total BEVs sold in the United States in 3Q24 were produced in North America, 7.3% were produced in South Korea, and 5.3% were produced in Germany.
To qualify for the clean vehicle tax credits in the Inflation Reduction Act, manufacturers must comply with domestic content requirements for final assembly, battery components, and critical mineral inputs that extend beyond simply manufacturing in North America. Therefore, not all vehicles classified as manufactured in North America will qualify for this credit. These requirements, while applicable to EV purchases, are less stringent for EV leases. Many EV purchases that do not qualify for the incentives under the clean vehicle tax credit will qualify for the tax credit when leased under the commercial clean vehicle credit, providing consumers with a wider variety of eligible EV models.
Principal contributor: Monica Abboud
Tags: vehicles