
What’s driving decreasing gasoline consumption in China?
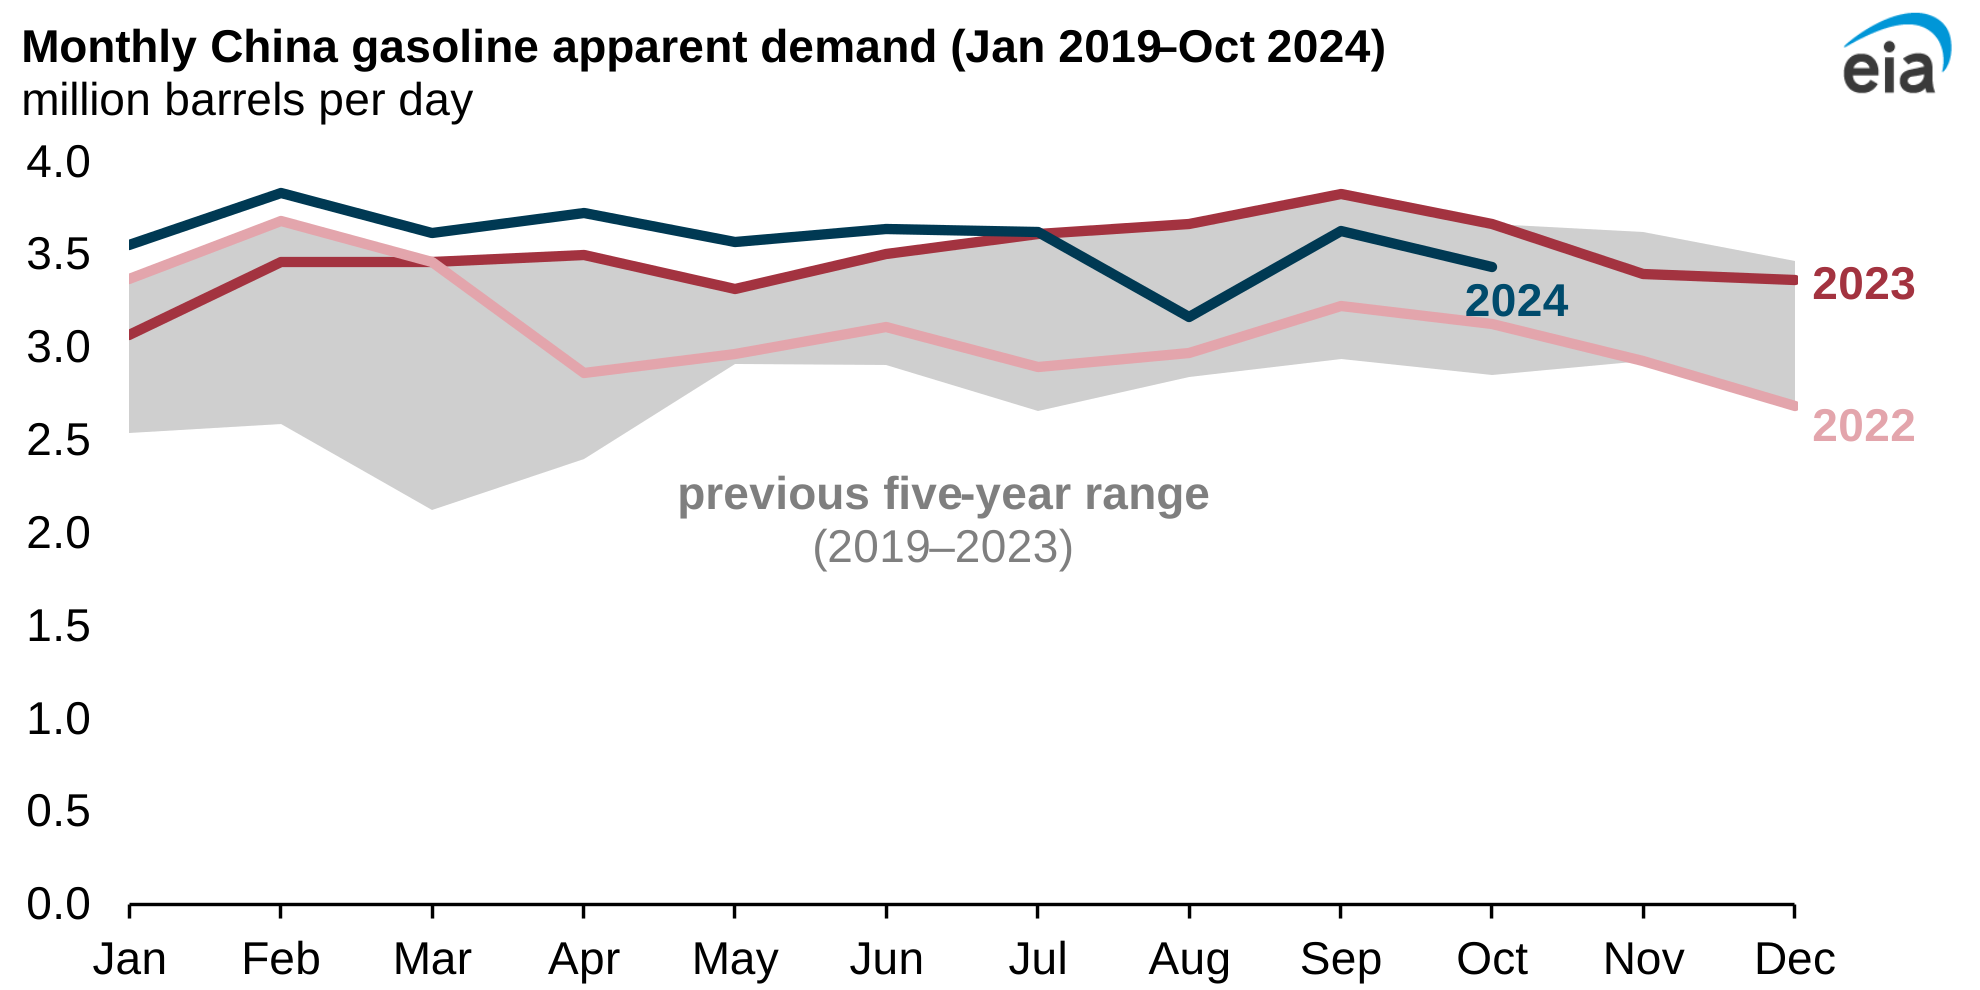
Note: We define apparent demand as refinery production plus imports minus exports.
Gasoline consumption in China has begun to fall in recent months amid increased sales of electric vehicles, slow economic growth, and population decline.
We estimate gasoline consumption in China averaged 3.2 million barrels per day (b/d) in August 2024, 14% less than in August 2023. The trend continued in September and October, which were down from the same months in 2023. From January through July of this year, more gasoline was consumed in China than the year before.
These trends led us to reduce our forecast growth in consumption of petroleum and liquid fuels in China in 2024 and 2025 in our Short-Term Energy Outlook (STEO). China’s growth of 0.1 million b/d in 2024 and 0.3 million b/d in 2025 will mostly be driven by petrochemical feedstocks instead of transportation fuels, reflecting increased petrochemical manufacturing in the country.
Combined sales of hybrid vehicles, plug-in hybrid electric vehicles, and battery electric vehicles (BEV) were more than half of total passenger vehicle sales in China in October 2024, according to Bloomberg data. This share of sales is up from 40% in October 2023.
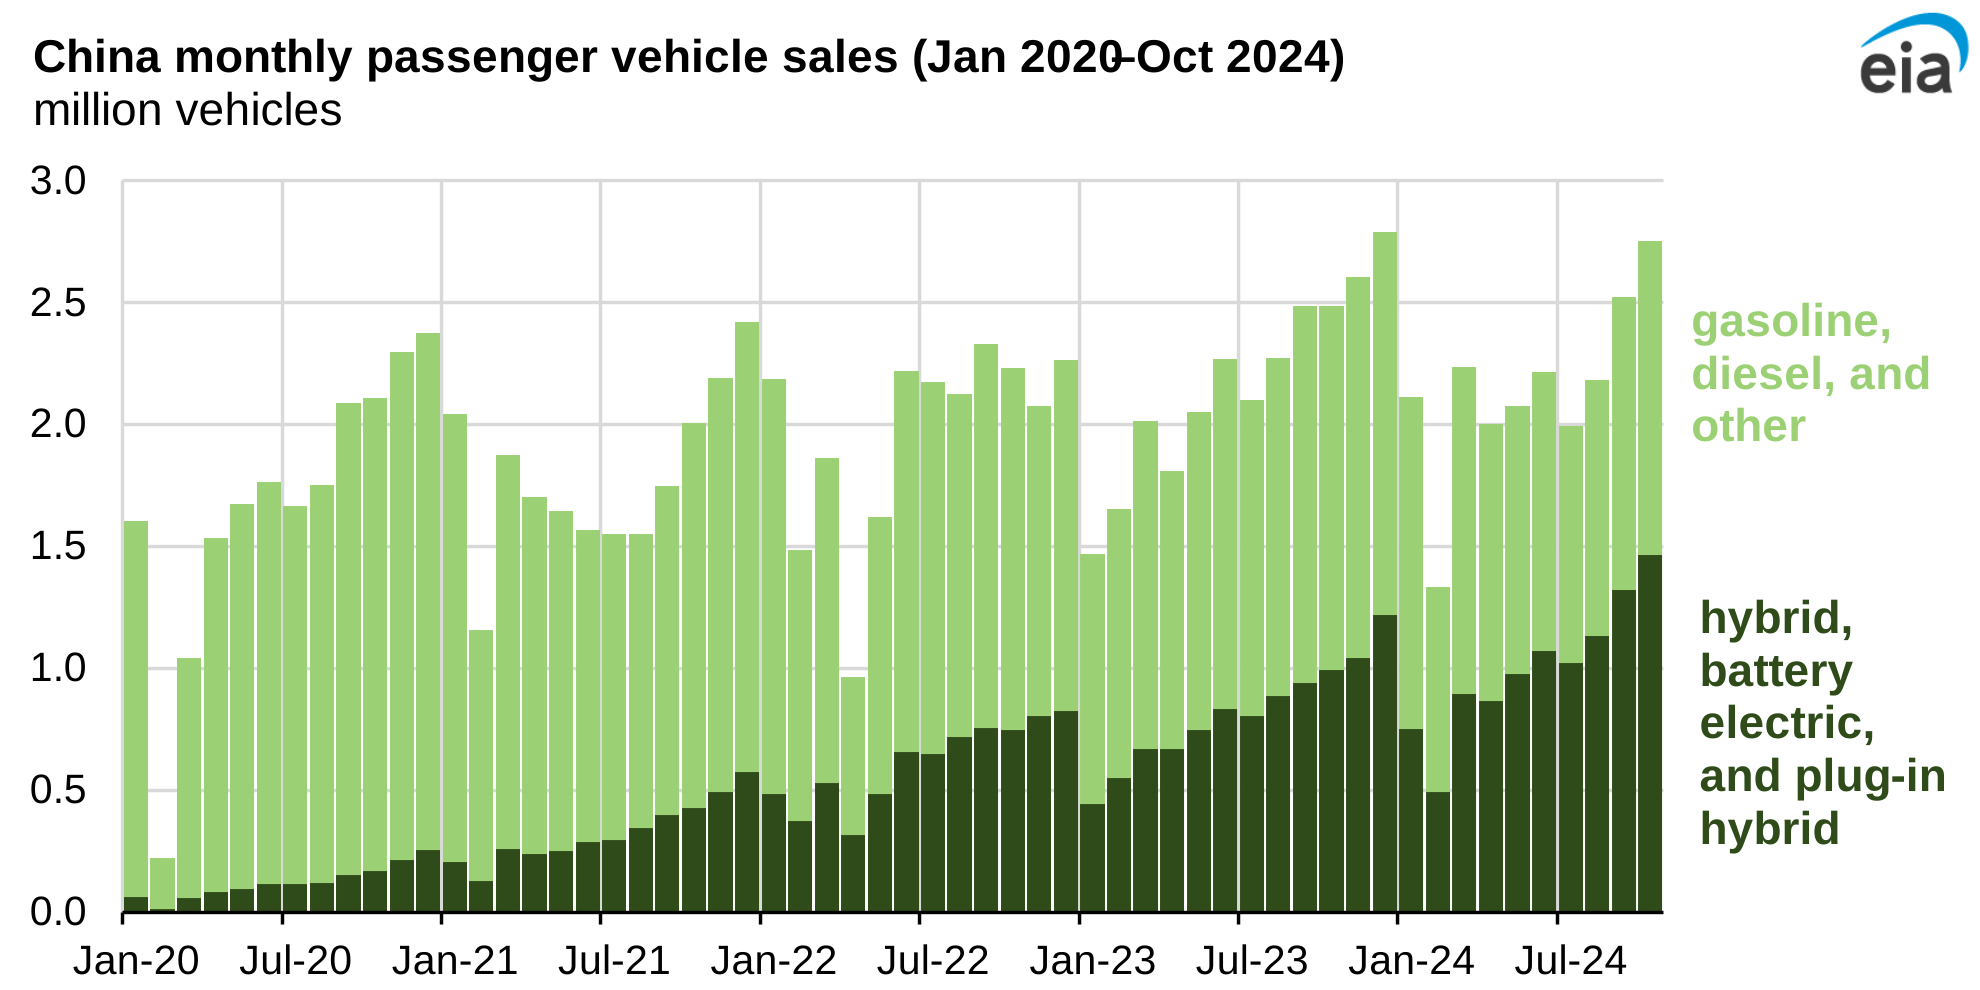
Note: Other includes compressed natural gas and fuel cell electric vehicles.
Although increased BEV and plug-in hybrid sales are only one factor moderating recent gasoline consumption in China, continued market penetration of these vehicles could weigh on the future of gasoline consumption.
In China, typically between 20 million and 25 million passenger vehicles are sold every year. In the future, depending on future sales trends and the number of internal combustion engines decommissioned, BEVs and hybrids could make up a large portion of the total vehicle fleet in China. Although we do not forecast consumption for individual petroleum products such as gasoline or diesel in countries other than the United States in our STEO, we factor in fundamental shifts that affect petroleum product consumption in our forecasts.
In China, increased sales of BEV and hybrid vehicles, a declining population, and slower economic growth have limited growth in gasoline consumption. Based on the latest forecast from Oxford Economics, China’s GDP is expected to grow by 4.1% in 2025, which is slower than the 6.7% GDP growth rate average from 2015 to 2019, before the COVID-19 pandemic. Oil consumption correlates with economic activity, and slower GDP growth could also be limiting gasoline consumption. In addition, China’s population has begun to decline, which may reduce total miles driven and gasoline consumption.
China’s National Bureau of Statistics and General Administration of Customs publish monthly data on crude oil refinery processing, refined petroleum product output, crude oil and petroleum product imports, and crude oil and petroleum product exports. The agencies do not publish inventory levels or stock changes. Because of this exclusion, we calculate China’s apparent demand of gasoline as refinery production of gasoline plus imports minus exports. This calculation is different from product supplied, our proxy for consumption in the United States, which accounts for stock changes. Despite lacking inventory data, China’s monthly petroleum statistics can serve as a useful guide for general trends in the country’s petroleum market.
Principal contributor: Jeff Barron
Tags: China, consumption/demand, gasoline, liquid fuels