
U.S. share of electric and hybrid vehicle sales increased in the second quarter of 2024
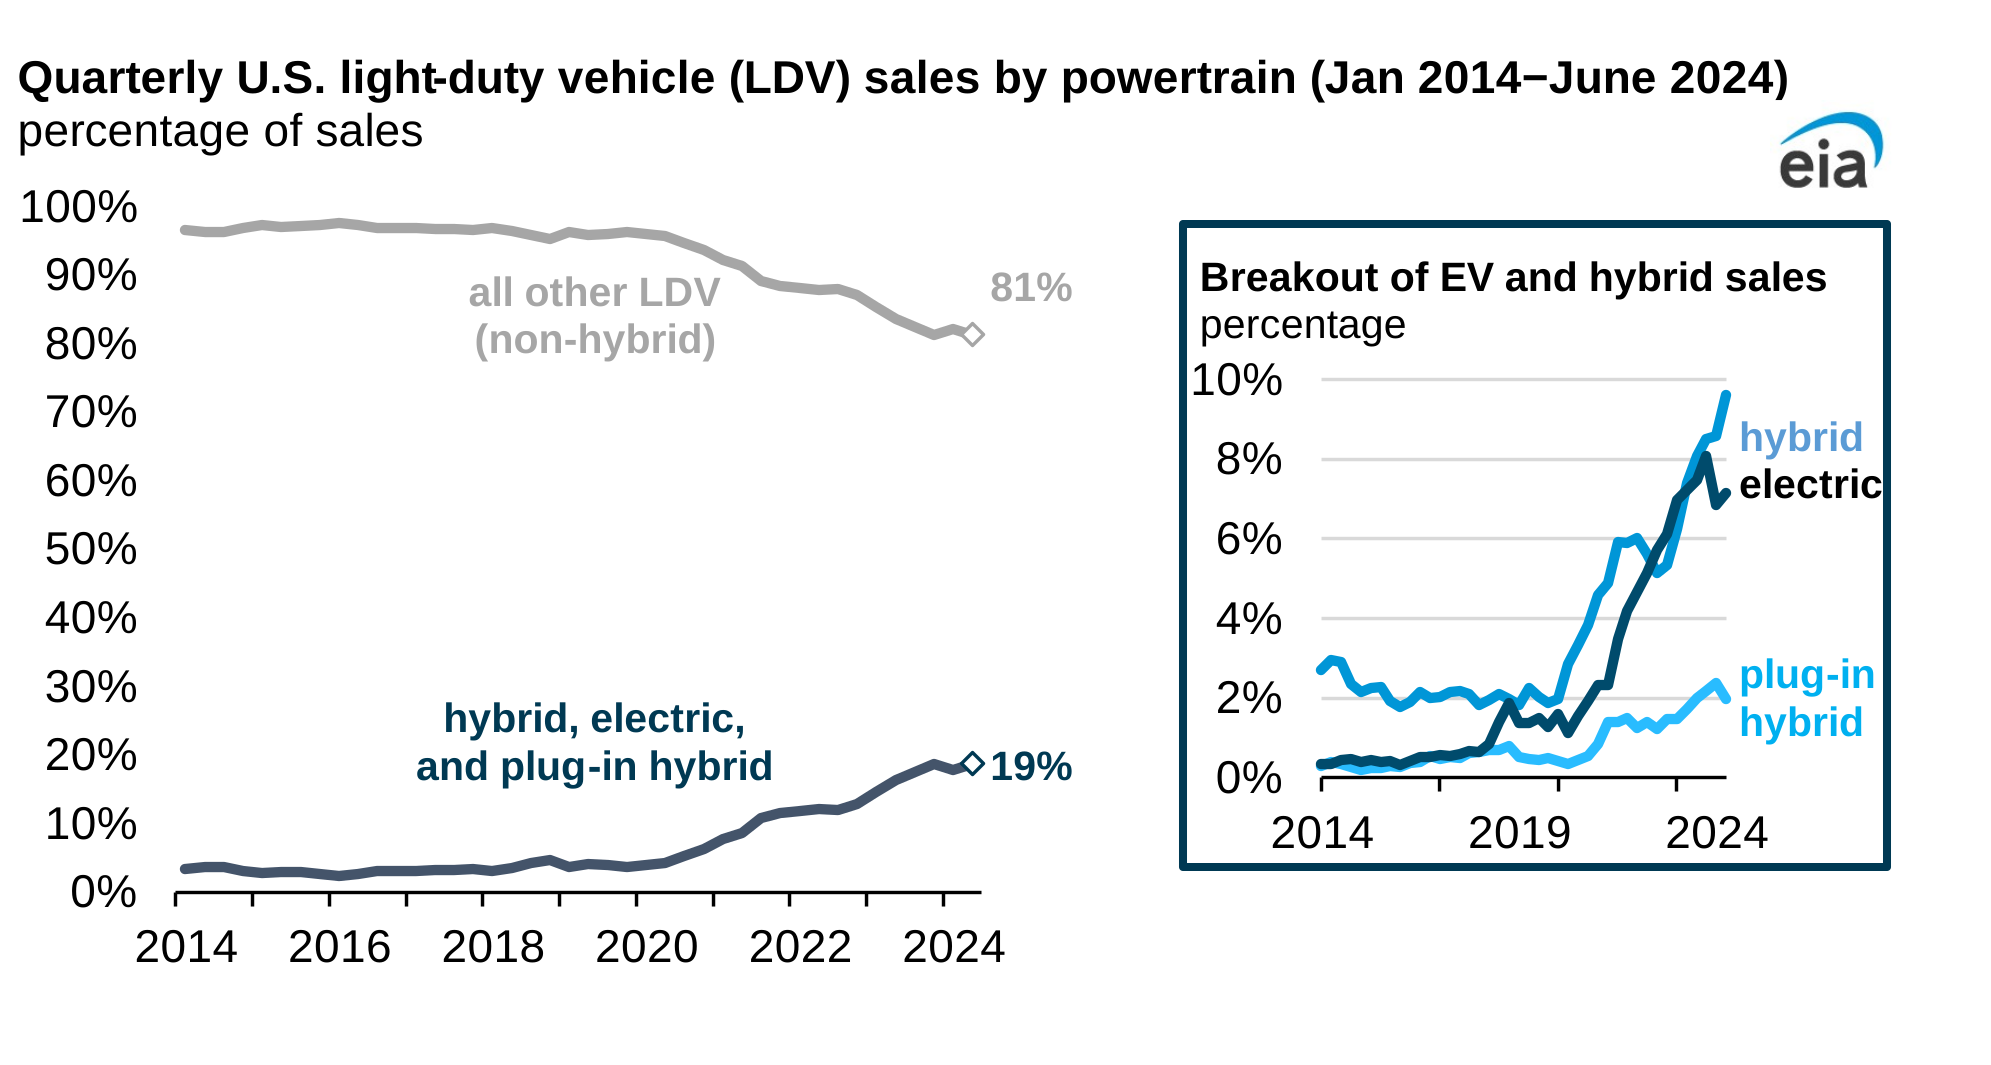
Note: EV=electric vehicles, which include both battery electric and plug-in hybrid electric vehicles
The share of electric and hybrid vehicle sales in the United States increased in the second quarter of 2024 (2Q24) after a slight decline in 1Q24. Combined U.S. sales of hybrid vehicles, plug-in hybrid electric vehicles, and battery electric vehicles (BEVs) increased from 17.8% of total new light-duty vehicle (LDV) sales in 1Q24 to 18.7% in 2Q24, according to estimates from Wards Intelligence.
This slight increase in the electric and hybrid vehicle market share was driven primarily by hybrid electric vehicle (HEV) sales, which increased by 30.7% year over year. Hybrid sales accounted for 8.6% of the total light-duty market in 1Q24 and increased to 9.6% in 2Q24. Plug-in hybrid electric vehicle sales increased slightly from 1.7% to 2.0% of the total light-duty market year over year. Following slower growth in 1Q24 compared with the previous year, in 2Q24, BEV sales accounted for 7.1% of the U.S. LDV market, a similar share to 2Q23.
Luxury electric vehicles continued to sell well, accounting for 32.8% of total luxury sales in 2Q24. U.S. luxury vehicle sales accounted for 16.6% of the total light-duty market in 2Q24, while luxury vehicles made up 73.8% of total battery electric sales, 8.3% of hybrid sales, and 29.2% of plug-in hybrid sales.
The average transaction price of BEVs in the United States, not including any government incentives, decreased from $57,405 in January 2024 to $56,371 in June 2024, according to data from Cox Automotive. BEV transaction prices were 21.1% higher than the overall average light-duty vehicle transaction price in January 2024 and 15.9% higher in June 2024.
Although Tesla is still the leading manufacturer in the electric vehicle market, it no longer holds the majority share of electric vehicle sales. Tesla’s market share accounted for 48.9% of the total electric vehicle market in 2Q24, decreasing to less than 50% of the light-duty vehicles sold for the first time since 4Q17. The sales have shifted to legacy manufacturers such as Ford, Chevrolet, Hyundai, and Kia. Ford accounted for 8.0% of sales in the electric vehicle market in 2Q24, the second-largest share, driven by the sales of the Mustang Mach-E and F-150 Lightning. Chevrolet’s sales shifted to its newly introduced electric Blazer, Silverado, and Equinox models following the manufacturer’s decision to stop producing the Bolt, a decision that decreased overall sales in 1Q24.
BEV manufacturers are producing vehicles both domestically and globally. According to estimates from Wards Intelligence, 74.4% of electric vehicles sold in the United States were manufactured in North America in 2Q24 compared with 78.7% in 2Q23. A year-over-year comparison shows that the total share of electric vehicles sold in the United States and manufactured in South Korea increased from 8.0% in 2Q23 to 12.2% in 2Q24 while the share of electric vehicles manufactured in Japan increased from 2.4% to 7.2%.
To qualify for the clean vehicle tax credits in the Inflation Reduction Act, manufacturers must comply with domestic content requirements for final assembly, battery components, and critical mineral inputs that extend beyond simply manufacturing in North America. Therefore, not all vehicles classified as manufactured in North America qualify for this credit.
Principal contributor: Monica Abboud