
California residents are increasingly pairing battery storage with solar installations
Updated on July 18 to correct the second chart.
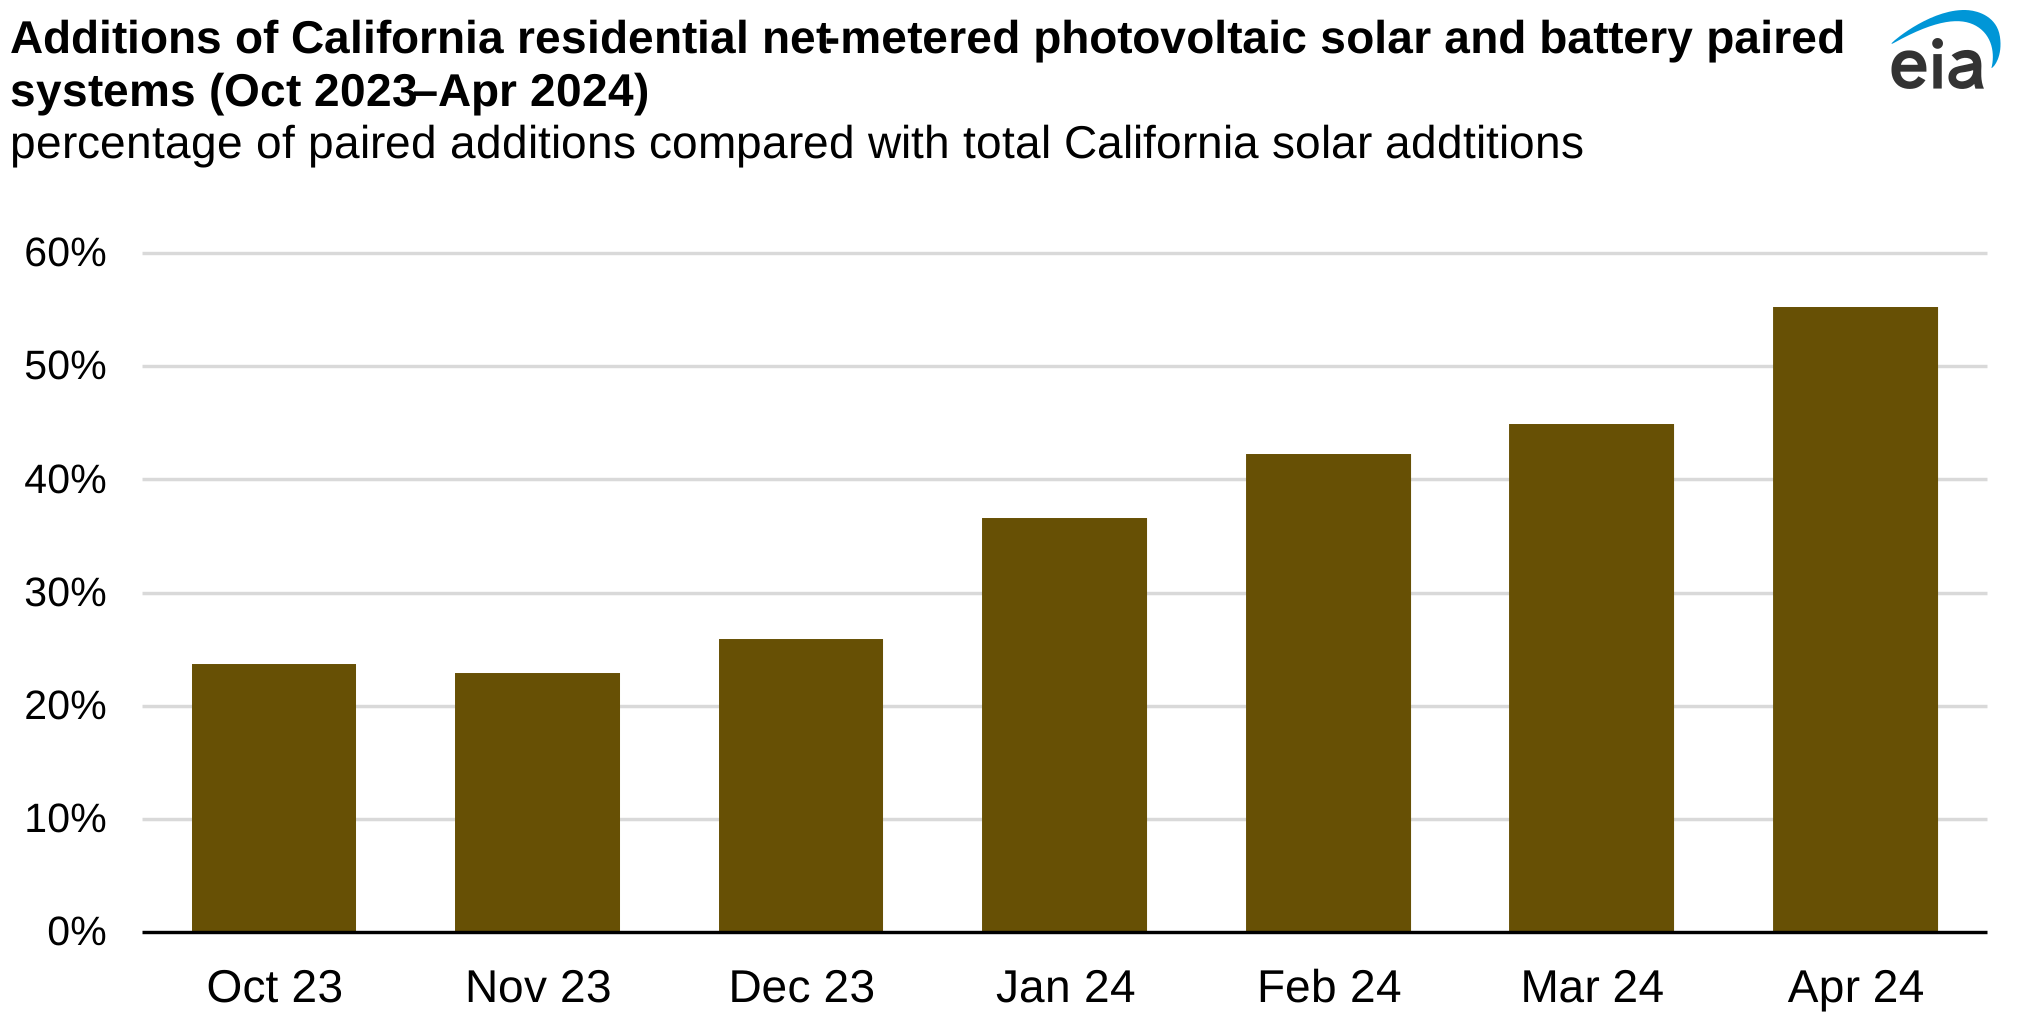
Note: Around 99.5% of the total small-scale residential installed capacity in California is net metered, a method for compensating behind-the-meter resources. Small-scale systems are less than one megawatt of installed capacity. Data from October 2023 to April 2024 are estimated preliminary data.
California residents are increasingly pairing battery storage with solar installations, according to the latest preliminary data in our Monthly Electric Power Industry Report.
The share of new residential solar photovoltaic systems paired with batteries has increased since we began collecting data in October 2023. In April 2024, more than 50% of residential solar photovoltaic installations were paired with battery storage, compared with just over 20% in October 2023.
The shift toward more battery storage at solar installations eligible for net metering came after changes to California’s compensation structure. Net metering compensates customers for the distributed generation output that is returned to the grid by crediting their electricity bills.
In April 2023, California revised how household generators with installed rooftop solar are compensated via net metering. The new structure, known as a net billing tariff (NBT), offers a variable compensation rate. The variable rate incentivizes pairing solar capacity installations with battery storage because batteries enable customers to send electricity to the grid during hours when demand is relatively high, typically in the evening when solar generators produce less.
Solar paired with battery installations makes up about 9% of all installed residential net metering capacity in California, with over 40,000 new installations added between October 2023 and April 2024. Those installations accounted for 232 megawatts (MW) of new battery storage capacity in the state.
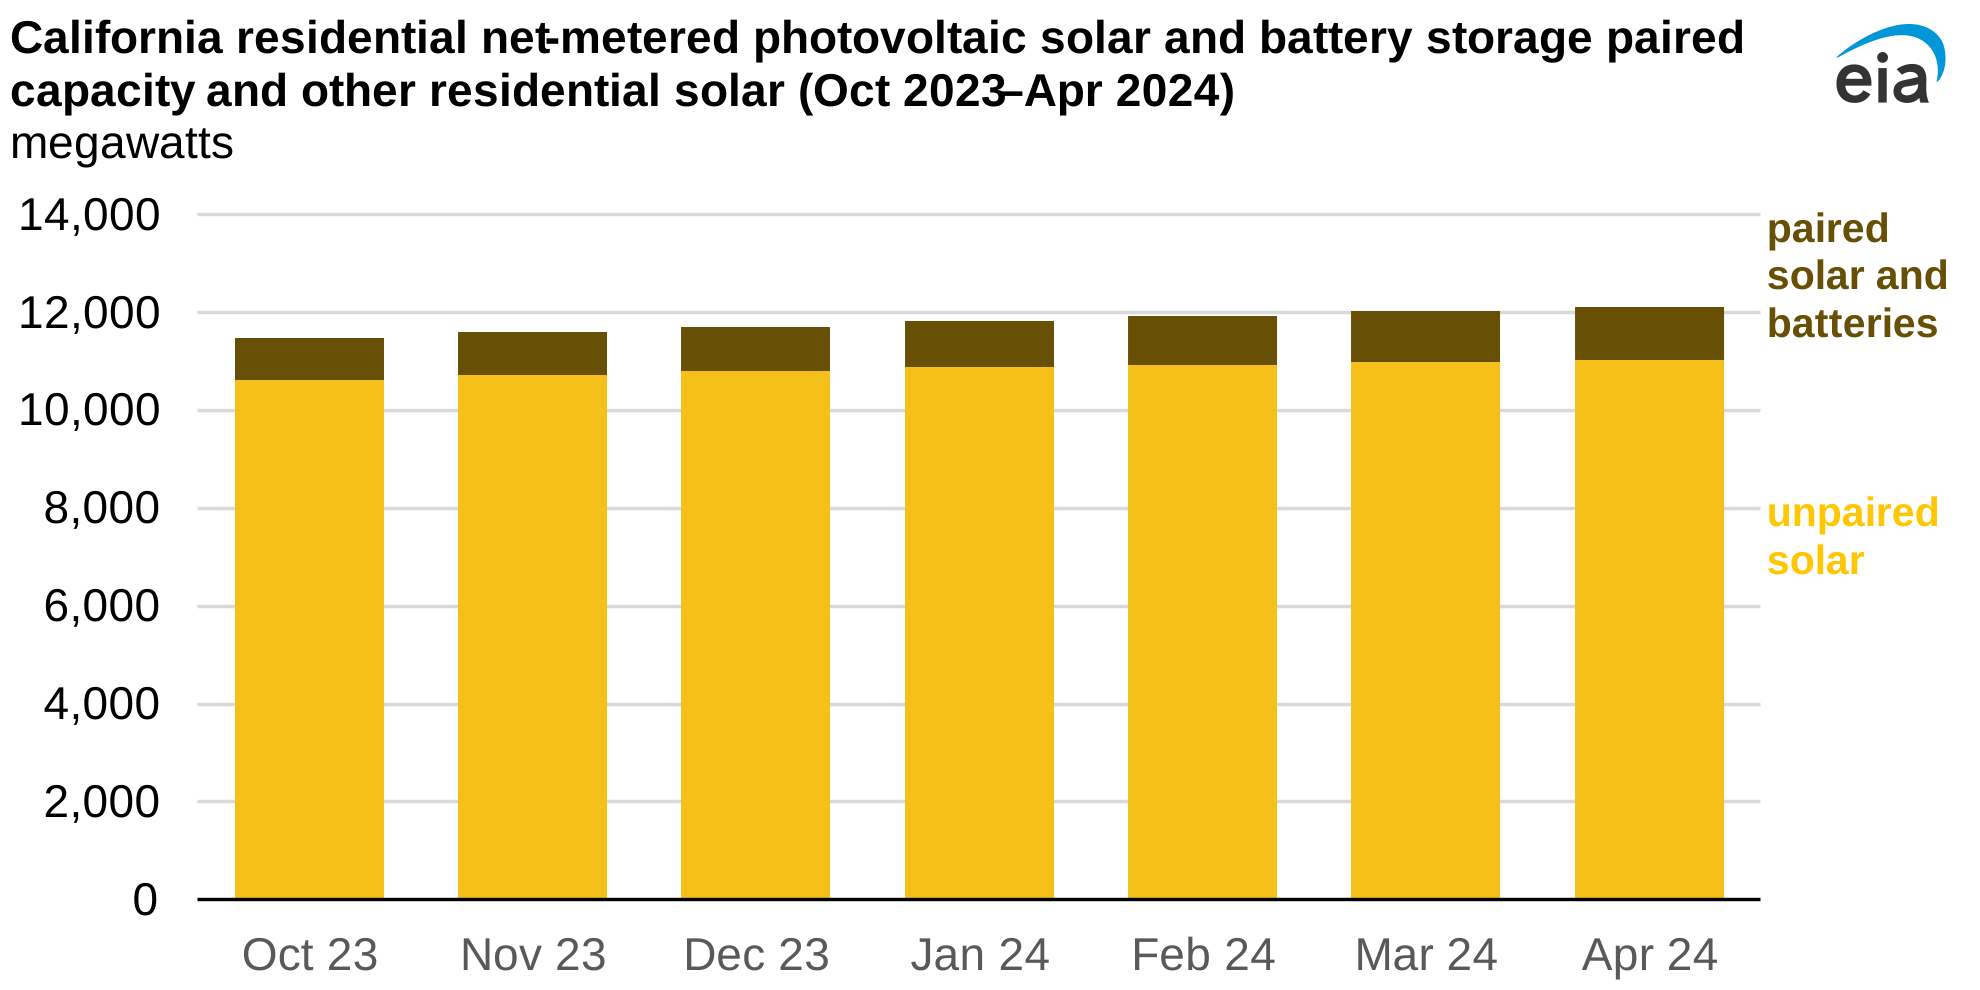
The increasing amount of battery storage comes after California residents installed a record amount of solar capacity eligible for compensation from electricity utilities in the third quarter of 2023.
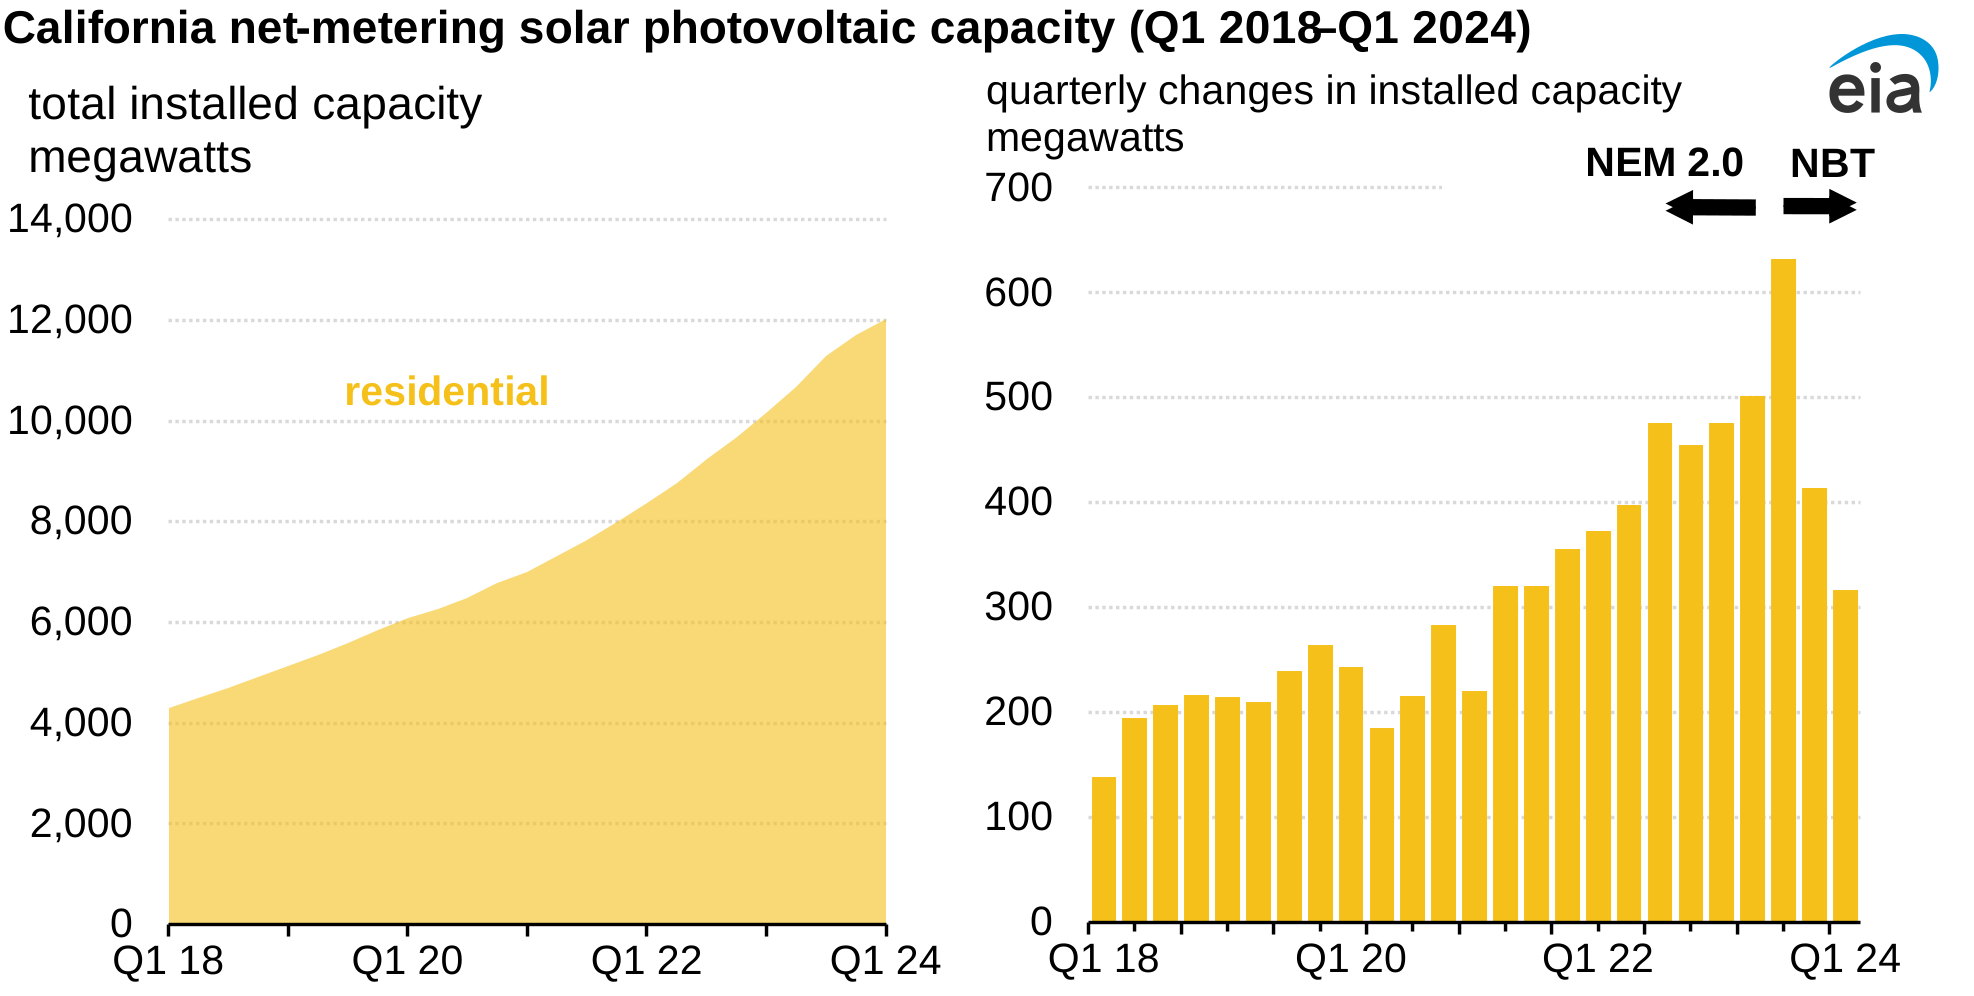
Note: Around 99.5% of the total small-scale residential installed capacity in California is net metered. Small-scale systems are less than one megawatt of installed capacity. Data from March 2023 to March 2024 are estimated preliminary data. Q1=the first quarter of the year; NBT=net billing tariff (new compensation rate); NEM=net energy metering (old compensation rate)
California residential solar capacity eligible for net metering increased by 22% in the third quarter of 2023 compared with the same period of 2022 as customers installed capacity before the compensation structure changed. The rate of growth slowed in the fourth quarter, after the changes went into effect, but net metering-related capacity continued to increase. California now has more than 12,000 MW of installed solar capacity in residential net metering systems smaller than 1 MW.
Under the new NBT structure, the reimbursement rate varies throughout the day depending on when the solar electricity is generated. This rate is, on average, less than the earlier compensation structure known as net energy metering 2.0 (NEM 2.0), which credited generators at a flat retail electricity rate.
Capacity installations increased initially after the California Public Utility Commission announced a grandfathering scheme for NEM 2.0 customers for 20 years, which led to an interconnection application backlog during the first quarter of 2023, according to an analysis of the impacts of the new policy by the Lawrence Berkeley National Laboratory.
In California, residential units account for more than 70% of the net metering installed capacity and approximately one-third of total solar capacity in the state. Our data show that during the third quarter of 2023, 83,376 new residential net metering photovoltaic systems were installed, compared with 70,152 systems connected under the old NEM 2.0 rule during the same period in 2022. However, we cannot differentiate the systems that requested to be grandfathered to NEM 2.0. The first quarter of 2024 saw an additional 46,631 systems installed. Since January 2022, an average of 21,000 solar systems were added every month.
We collect the capacity of distributed resources that are net metered and non-net metered and then publish that data by utility and state in our detailed data files.
Principal contributors: Alex Gorski, Katherine Antonio
Tags: residential, generation, electricity, storage, solar, California, states, net metering