
Electricity demand surged in New England amid heat wave
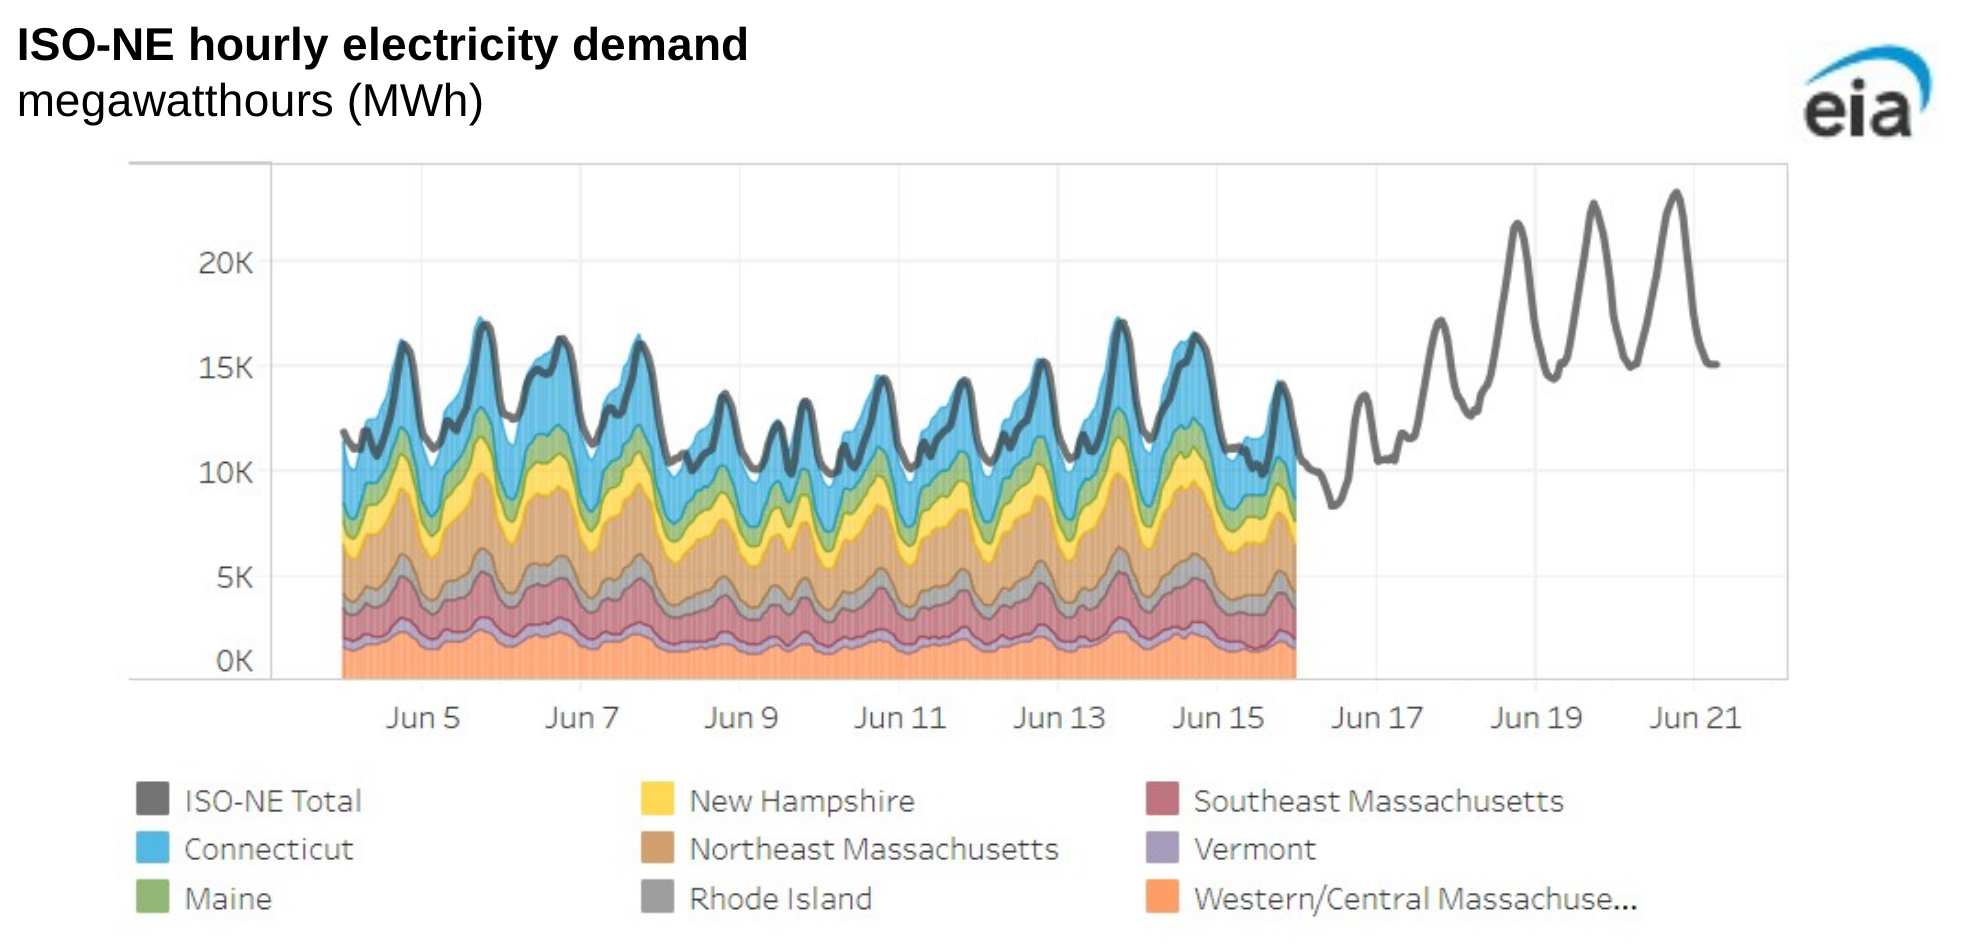
Note: Data on demand by region lags total demand. ISO-NE=Independent System Operator of New England
Electricity demand in New England surged this week as high temperatures persisted through much of the United States.
Demand in the electric grid territory of New England’s Independent System Operator (ISO-NE) peaked at 23,324 megawatts (MW) during the evening of June 20, approaching last year’s peak hourly demand in this region. The June 20 peak around 7:00 p.m. eastern time was 521 MW above the June 19 peak demand of 22,803 MW, around 6:00 p.m. ISO-NE expects less demand over the weekend and into early next week as temperatures cool.
Peak electricity demand on both June 19 and 20 were a bit less than the 24,553 MW of peak hourly demand forecast in ISO-NE’s summer assessment issued on June 3, 2024. Hourly demand for electricity in ISO-NE for 2023 peaked at 24,043 MW. To meet the demand, utilities in New England burned more natural gas. Natural gas burned in the power sector in ISO-NE reached nearly 2.0 billion cubic feet (Bcf) on both June 19 and 20, according to S&P Global Commodity Insights, compared to about 1.20 Bcf per day consumed on the Wednesday and Thursday of the previous week.
Other regions are also experiencing increased electricity demand. Electricity demand in the PJM Interconnection, which covers a large region from New Jersey to Illinois, peaked at 145,892 MW on June 20, about the same amount as demand on June 19. In its Summer 2024 Reliability Assessment, PJM forecasted peak hourly demand for the season reaching 151,000 MW.
We track hourly electricity market data in our Wholesale Electricity Market Portal, where users can examine and access electricity markets data for the seven Regional Transmission Organizations (RTO) and ISOs. The portal also includes information on power generation type, regional temperatures, and wholesale pricing. Our New England Dashboard also includes information on the region’s natural gas and petroleum markets.
Principal contributors: Mark Morey, Chris Peterson
Tags: consumption/demand, electricity, weather, New England