
U.S. share of electric and hybrid vehicle sales decreased in the first quarter of 2024
Note: EV=electric vehicles, which include both battery electric and plug-in hybrid electric vehicles.
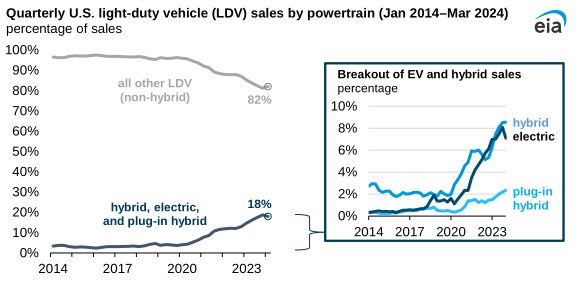
The share of electric and hybrid vehicle sales in the United States decreased in the first quarter of 2024 as battery electric vehicle (BEV) sales declined. Hybrid vehicles, plug-in hybrid electric vehicles, and BEVs fell to 18.0% of total new light-duty vehicle (LDV) sales in the United States in the first quarter of 2024 (1Q24) from 18.8% in 4Q23, according to estimates from Wards Intelligence.
This slight decline in market share was driven primarily by BEV sales, which fell from 8.1% of the total LDV market in 4Q23 to 7.0% in 1Q24. This decline represents the first BEV market share decline since the economic effects from the COVID-19 pandemic began in 2Q20.
The U.S. LDV market is highly seasonal, and total sales usually level off in the first quarter after an end-of-year sales increase. BEV sales grew 7% in 1Q24 compared with 1Q23 after 13 consecutive quarters of double-digit gains. The slowdown in growth can be broken into two components:
- An uneven decline in the overall new LDV sales market, where luxury vehicle sales declined more than mass-market sales
- A decline in mass-market BEV sales
BEVs continue to be popular in the luxury vehicle segment, maintaining about one-third of luxury LDV sales from 1Q23 through 1Q24. Of all BEV sales in 1Q24, 8 out of 10 sales were luxury models, in part due to the continued wide availability of luxury BEV options and favorable within-segment pricing from Tesla, Mercedes, Rivian, Cadillac, Audi, and BMW.
U.S. luxury-vehicle sales varied between 12% and 15% of the overall LDV market between 2014 and 2020 but grew to reach 18% in 2023. Luxury-vehicle sales returned to pre-pandemic levels in mid-2022, but mass-market vehicle sales have remained 10% below pre-pandemic levels as of this quarter. This uneven recovery contributed to the rise in the BEV sales share in 2022 and 2023. In 1Q24, the trend reversed when luxury vehicles fell to 16% of the market. Further return to the pre-pandemic luxury and mass-market split may continue to slow BEV sales growth in the absence of new mass-market BEV models.
Historically, BEV sales have not performed as well in the mass-market segment as they have in the luxury segment in the United States. Total U.S. sales of mass-market LDVs declined by 1.0%, and total mass-market BEV sales fell 17.9%, reducing the market share of BEV models from 2.2% in 4Q23 to 1.8% in 1Q24. Manufacturers have released mass-market BEV models and increased production capacity over the past couple of years, but the halt in Chevrolet Bolt production and the corresponding 64% reduction in year-over-year sales for that vehicle pulled the mass-market BEV market share down in 1Q24.
The U.S. industry average LDV transaction price decreased slightly during 1Q24 as luxury vehicles lost market share. According to Cox Automotive, average BEV transaction prices fell 3.8% compared with 4Q23 and 9.0% compared with 1Q23. Average 1Q24 BEV transaction prices were $6,904 higher than the overall industry average (combined luxury and non-luxury) and $7,290 lower than the average for luxury vehicles, before accounting for any consumer or government incentives.
Principal contributor: Michael Dwyer
Tags: electricity, vehicles