
U.S. natural gas consumption established a new daily record in January 2024
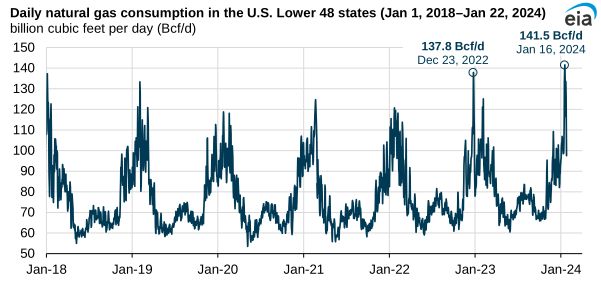
On January 16, 2024, a record high of 141.5 billion cubic feet (Bcf) of natural gas was consumed in the U.S. Lower 48 states (L48), exceeding the previous record set on December 23, 2022, according to estimates from S&P Global Commodity Insights. Well-below-normal temperatures caused by a large mass of arctic air that covered most of the continental United States increased demand of natural gas used for residential and commercial space heating and for electric power generation. Both consumption of natural gas and withdrawals from underground storage increased to record volumes because of the higher demand.
Natural gas consumption in the L48 averaged above 130.0 billion cubic feet per day (Bcf/d) from January 14 through January 21, 2024, as arctic air pushed south into the United States, causing temperatures to fall. Extreme wind chills, freezing rain, and snowy conditions persisted from the Pacific Northwest into Texas and across the Northeast and mid-Atlantic. Residential and commercial natural gas consumption accounted for almost 49% of L48 consumption during that period, up from 42% during the start of January, as homes and commercial buildings used more natural gas for heating. Electricity generation also increased during that time, with natural gas-fired and coal-fired electricity generation increasing to meet increased demand.
Natural gas was also withdrawn from underground storage at close to record volumes to meet the increased heating and electricity consumption during the cold snap. Weekly net withdrawals of natural gas from underground storage in the L48 for the week of Saturday, January 13, through Friday, January 19, totaled 326 Bcf, the third-most for any week on record, according to our Weekly Natural Gas Storage Report.
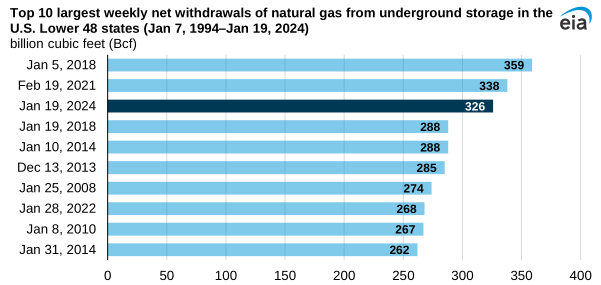
Note: Weekly net natural gas storage withdrawals are measured across a seven-day period. Dates listed above correspond to the last day of each seven-day period.
This large natural gas storage withdrawal helped offset reduced U.S. natural gas production. Some of the decline in natural gas production was likely a result of freeze-offs—which occur when water and other liquids in the raw natural gas stream freeze at the wellhead or in gathering lines near production—as well as other issues caused by the cold weather. U.S. dry natural gas production, which had been averaging close to 104.0 Bcf/d in the beginning of January, declined about 10.0 Bcf/d to close to 94.0 Bcf/d over the week of January 13, according to estimates from S&P Global Commodity Insights.
Principal contributors: Max Ober, Andrew Iraola
Tags: natural gas, consumption/demand, weather