
Associated natural gas production has tripled since 2018 in top three Permian oil plays
Note: Information on EIA's classification of oil and natural gas wells is available in our Drilling Productivity Report Supplement. The three major oil plays are the Spraberry, Wolfcamp, and Bone Spring plays. Data reflect the average from January through July 2023.
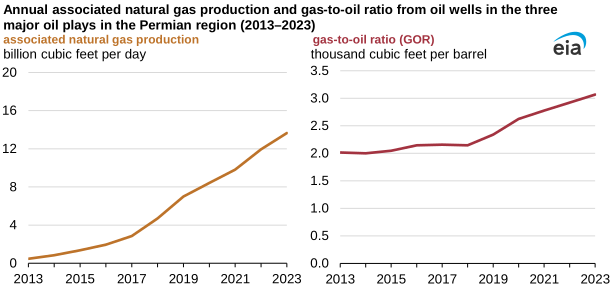
Production of associated-dissolved natural gas, or associated natural gas, which is natural gas produced from predominantly oil wells, has nearly tripled since 2018 in the three top-producing tight oil plays in the Permian region. Associated natural gas from the Wolfcamp, Spraberry, and Bone Spring plays averaged a combined 13.7 billion cubic feet per day (Bcf/d) in the first seven months of 2023, up from an average of 4.7 Bcf/d in 2018, according to data from Enverus DrillingInfo. Associated natural gas production has grown due to increases in both crude oil production and the volume of natural gas per barrel of oil that a well produces, the gas-to-oil ratio (GOR), among the oil wells in these three plays.
Any increase in the GOR in an oil well means more natural gas per barrel of oil is being produced. We define oil wells as those with a GOR of less than or equal to 6.0 thousand cubic feet of natural gas per barrel of oil produced (Mcf/b). We classify wells with a GOR of more than 6.0 Mcf/b as natural gas wells.
The Permian region, which spans parts of western Texas and southeastern New Mexico, produces more crude oil than any other region in the United States, accounting for more than 40% of total U.S. crude oil production. The Permian is the second-largest natural gas-producing region in the country, accounting for about a quarter of total U.S. marketed natural gas production. Most of the natural gas produced in the Permian region is associated natural gas. Consequently, in the Permian region, increased crude oil production has also increased associated natural gas production. Average crude oil production in the first nine months of 2023 increased by 68% in the Permian compared with 2018, while natural gas production in the Permian increased by 104% over the same period, according to our Drilling Productivity Report.
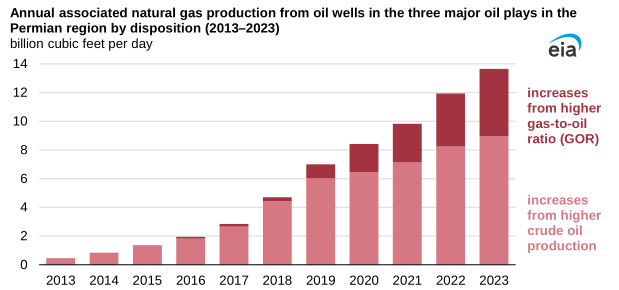
The Spraberry, Wolfcamp, and Bone Spring plays produce most of the associated natural gas within the Permian region. In 2023, these three plays produced 13.2 Bcf/d more associated natural gas than in 2013. Higher crude oil production accounted for 65% of the increase in natural gas production, and 35% of the increase came from a higher GOR, which rose from 2.0 Mcf/b in 2013 to 3.1 Mcf/b in the first seven months of 2023.
Note: Information on EIA's classification of oil and natural gas wells can be found in our Drilling Productivity Report Supplement. The three major oil plays are the Spraberry, Wolfcamp, and Bone Spring plays. Increases in associated natural gas production from a higher GOR are compared with the 2013 average GOR of 2.0 thousand cubic feet of natural gas per barrel of oil produced. Data reflect the average from January through July 2023.
As more oil and natural gas are released within a well, the GOR tends to progressively increase, increasing the volume of associated natural gas produced per every barrel of oil. Pressure within the reservoir declines progressively as more oil is brought to the surface, which allows more natural gas to be released from the geologic formation.
We provide a national breakdown of crude oil and natural gas production volumes based on well type classification annually.
Principal contributors: Troy Cook, Max Ober
Tags: natural gas, wells, Permian, production/supply