
The United States exported more LNG than any other country in the first half of 2023
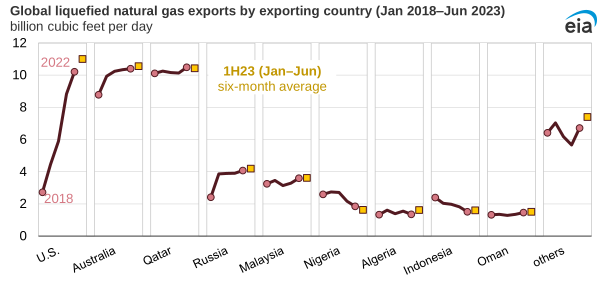
Note:1H23=first half of 2023. Includes annual liquefied natural gas exports by country for 2018–2022 and 1H23 average exports for 2023.
The United States exported more liquefied natural gas (LNG) than any other country in the first half of 2023 (1H23), according to data from CEDIGAZ. U.S. LNG exports averaged 11.6 billion cubic feet per day (Bcf/d) during this period, 4% (0.5 Bcf/d) more than in 1H22, according to data from the U.S. Department of Energy’s LNG Reports. Australia exported the world’s second-largest volume of LNG in 1H23, averaging 10.6 Bcf/d, followed by Qatar at 10.4 Bcf/d. The increase in U.S. LNG exports mainly resulted from Freeport LNG’s return to service as global LNG demand remained strong with continuing growth, particularly in Europe.
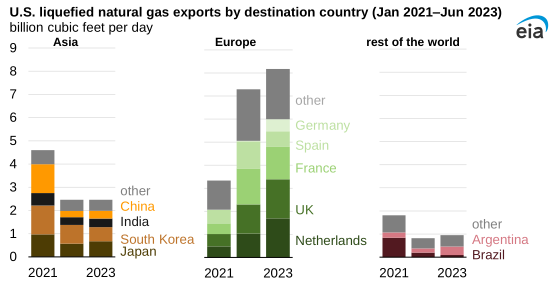
Note: Data are annual averages for 2021 and 2022 and the six-month (Jan–Jun) average for 2023.
Like in 2022, EU countries (Europe) and the UK remained the main destination for U.S. LNG exports in 1H23, accounting for 67% (7.7 Bcf/d) of total U.S. exports. Five countries—the Netherlands, the UK, France, Spain, and Germany—imported more than one-half (6.0 Bcf/d) of total U.S. LNG exports.
U.S. LNG exports set a monthly record of 12.4 Bcf/d in April as Freeport LNG ramped up LNG production and as Europe and the UK continued to increase LNG imports to compensate for reduced pipeline imports from Russia and to refill storage inventories. Europe and the UK’s regasification capacity continued to expand in 2023 as new terminals were placed in service in Finland, Germany, Italy, and Spain, allowing those countries to import more LNG. After a mild winter, Europe and the UK ended the 2022–23 heating season with the most natural gas in storage on record, and the region continued importing LNG to rapidly refill its storage inventories in the spring and summer.
In the first six months of this year, Europe and the UK’s LNG imports exceeded imports by pipeline for the first time on record, according to data from Refinitiv Eikon. Europe and the UK’s LNG imports averaged 15.9 Bcf/d, 0.1 Bcf/d more than that region's imports by pipeline from all sources. In 2022, LNG imports to the region averaged 14.9 Bcf/d annually, 28% (5.8 Bcf/d) less than natural gas imports by pipeline. Europe and the UK’s LNG imports peaked in April 2023 at 18.0 Bcf/d and remained above natural gas imports by pipeline from April through June 2023.
Principal contributor: Victoria Zaretskaya