U.S. Energy Information Administration logo
Skip to sub-navigation
April 5, 2012

Spot crude prices near 12-month high; natural gas and power prices near 12-month low

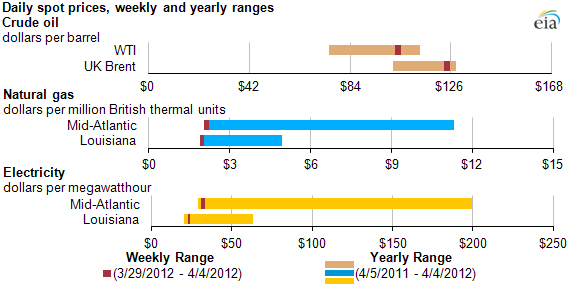
graph of Daily spot prices, weekly and yearly ranges, as described in the article text
Source: U.S. Energy Information Administration, based on Thomson Reuters and SNL Energy.
Note: WTI represents West Texas Intermediate crude oil.
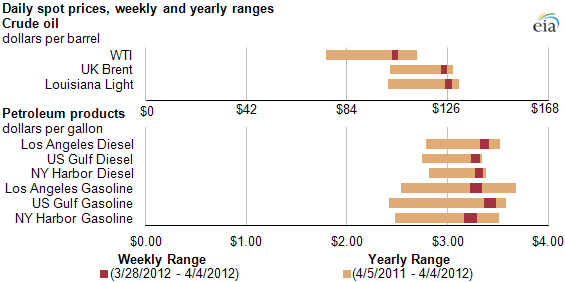
graph of Daily spot prices, weekly and yearly ranges, as described in the article text
Source: U.S. Energy Information Administration, based on Thomson Reuters and SNL Energy.
Notes: WTI represents West Texas Intermediate crude oil. The price ranges for crude oil and petroleum products are aligned because there are 42 gallons per barrel of crude oil.
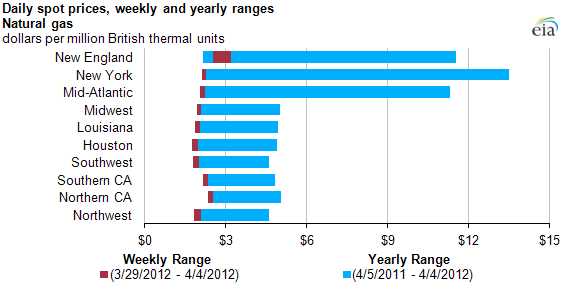
graph of Daily spot prices, weekly and yearly ranges, as described in the article text
Source: U.S. Energy Information Administration, based on Thomson Reuters and SNL Energy.

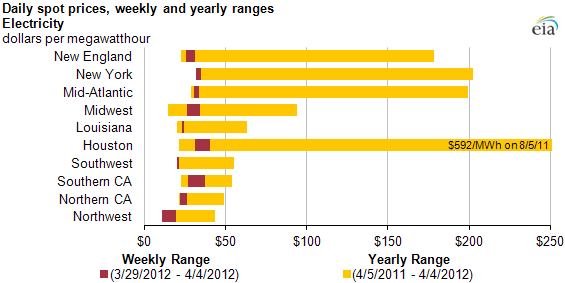
graph of Daily spot prices, weekly and yearly ranges, as described in the article text
Source: U.S. Energy Information Administration, based on Thomson Reuters and SNL Energy.

Key wholesale energy price benchmarks for crude oil, natural gas, and electric power reflect contrasting trends over the past year. International events have contributed to higher wholesale crude oil prices, whereas high levels of domestic natural gas production coupled with mild weather and record storage inventories have lowered wholesale natural gas prices. Because natural gas remains the marginal fuel in most electric power markets and because low heating and cooling demand in recent weeks have reduced electricity demand, electric power prices remain low as well. The figures above compare recent weekly price ranges (for March 29, 2012 - April 4, 2012) to the range of wholesale prices during the past year.

Statistics
Analysis
Tools
Education
News

Petroleum & Other Liquids

Crude oil, gasoline, heating oil, diesel, propane, and other liquids including biofuels and natural gas liquids.

Natural Gas

Exploration and reserves, storage, imports and exports, production, prices, sales.

Electricity

Sales, revenue and prices, power plants, fuel use, stocks, generation, trade, demand & emissions.

Coal

Reserves, production, prices, employment and productivity, distribution, stocks, imports and exports.

Nuclear & Uranium

Uranium fuel, nuclear reactors, generation, spent fuel.

Renewable & Alternative Fuels

Includes hydropower, solar, wind, geothermal, biomass and ethanol.

EIA Survey Forms

Forms EIA uses to collect energy data including descriptions, links to survey instructions, and additional information.

Total Energy

Comprehensive data summaries, comparisons, analysis, and projections integrated across all energy sources.

U.S. States

State energy information, including overviews, rankings, data, and analyses.

International

International energy information, including overviews, rankings, data, and analyses.

Environment

Greenhouse gas data, voluntary reporting, electric power plant emissions.

Data Tools, Apps, & Maps

Tools to customize searches, view specific data sets, study detailed documentation, and access time-series data.

Open Data

EIA's free and open data available as API, Excel add-in, bulk files, and widgets

EIA Beta

Come test out some of the products still in development and let us know what you think!

Open Source Code

EIA's open source code, available on GitHub.

RSS Feeds

Subscribe to feeds for updates on EIA products including Today in Energy and What's New.