
ERCOT electricity prices vary more with changes in wind power than with electricity demand
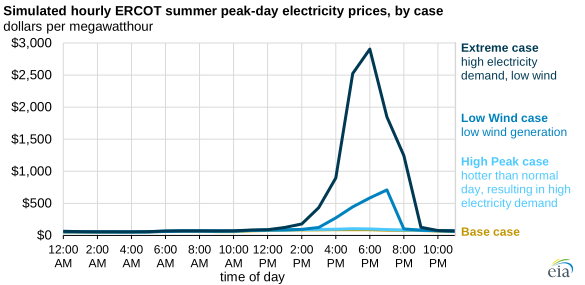
In the Short-Term Energy Outlook Supplement released on October 4, we analyzed how variability in electricity demand and wind generation affects hourly electricity prices in Texas’s wholesale power market under summer peak-day conditions, when summer electricity demand is highest. The Electric Reliability Council of Texas (ERCOT)—which runs the wholesale power market in Texas—has had significant peak-load growth in recent years (16% between 2011 and 2022) and significantly increased its wind generation (from 9% of the electricity generation mix in 2011 to 24% in 2021). We found that both high levels of electricity demand and low wind availability can significantly raise wholesale prices in ERCOT, supported by its market design. When combined, these factors can lead to especially sharp price spikes during summer peak-day conditions.
We evaluated four cases in Sources of Price Volatility in the ERCOT Market:
- Base case, which assumes a normal summer peak day in Texas
- High Peak case, which assumes a hotter-than-normal summer day, resulting in higher electricity demand
- Low Wind case, which assumes a normal summer peak day with very low wind generation
- Extreme case, which assumes a hotter-than-normal summer day and very low wind generation
Our analysis shows that electricity prices in ERCOT during the summer follow a typical daily pattern. In the morning, electricity demand is relatively low, and prices are also relatively low. As the day continues, economic activity and temperatures increase, resulting in higher electricity demand and prices.
Although this pattern is present in all four cases, the range of prices in the afternoon varies because of differences in weather (temperature, wind, or both). In our Base case, the highest hourly electricity price reaches $90 per megawatthour (MWh). In our High Peak case, which assumes a hotter-than-normal summer day, the peak price increases to $105/MWh. A much larger price increase occurs when wind levels drop. In the Low Wind case, the peak price jumps to $709/MWh, and in the Extreme case, the peak hourly electricity price rises to $2,905/MWh.
The wide range of simulated peak prices in our cases ($90/MWh to $2,905/MWh) reflects ERCOT’s wholesale market design. Wholesale electricity prices include a unique electricity price adder. The price adder captures the value of the grid’s resource supply, so market conditions cause the price adder to vary:
- When the system has enough resources to meet demand and to respond in an emergency, additional resources provide minimal grid benefits and, therefore, have a low value. This condition occurs in our Base case and High Peak case; resources are plentiful, and the electricity price adder is less than $1/MWh.
- Very low wind generation in the Low Wind case and Extreme case, however, reduces supply. Without sufficient supply, a system emergency will more likely trigger rolling blackouts. In the ERCOT market, reduced grid reliability becomes an electricity price adder. In the Extreme case, the electricity price adder reaches $2,304/MWh, accounting for 79% of the total wholesale electricity price.
Through this price adder, ERCOT signals to market participants the benefit of new resource investment.
You can find more information in our full analysis, Sources of Price Volatility in the ERCOT Market.
Principal contributor: Debra Warady
Tags: consumption/demand, electricity, wind, Texas