
In 2020, most U.S. households prepared at least one hot meal a day at home
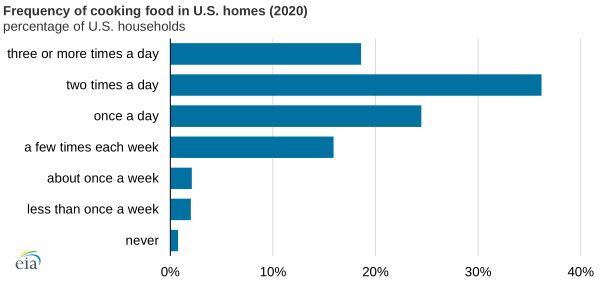
In 2020, 79% of U.S. households prepared at least one hot meal at home each day, according to our 2020 Residential Energy Consumption Survey (RECS). Households in the Pacific Census Division and the New England Census Division were generally more likely to cook hot meals at home daily. For example, in Washington (in the Pacific Census Division), 88% of households prepared at least one hot meal each day, and in Maine (New England Census Division), the share was 86%. Households in the South, such as Alabama (69%) and Louisiana (68%), were less likely to cook hot meals daily.
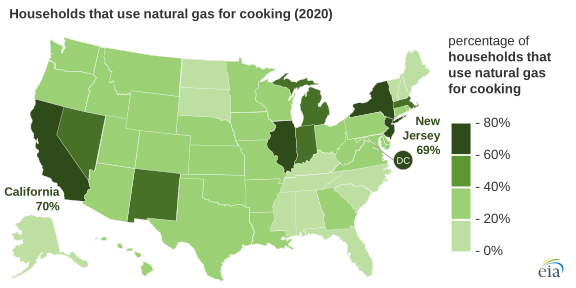
The majority of U.S. households (89%) have a range (a cooktop attached to an oven). In those households, the cooktop was used an average of eight times a week, and oven use averaged three times a week. Nationwide, electricity is the most common energy source used for cooking. About 38% of U.S. households use natural gas for cooking. States where households are most likely to use natural gas for cooking include California (70%) and New Jersey (69%). These estimates do not include fuel used for outdoor grilling.
In addition to ranges, cooktops, and ovens, our survey asked respondents how they use a variety of other kitchen appliances, including microwaves, coffee makers, toasters, toaster ovens, slow cookers, and electric pressure cookers. Almost all U.S. households have at least one microwave. In 2020, 75% of U.S. households used an electric coffee maker at least occasionally, and 56% of households used an electric coffee maker daily. Fewer than half of households in Utah used an electric coffee maker, significantly lower than in every other state.
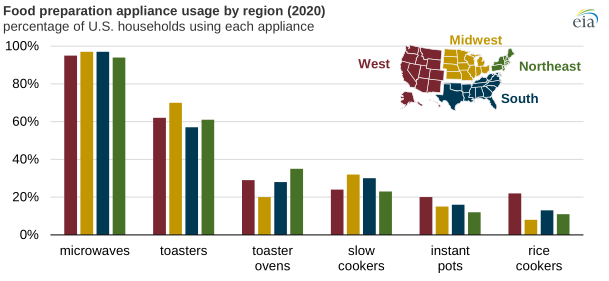
The 2020 RECS was the first RECS to ask about instant pots. In 2020, 16% of U.S. households used instant pots at least once a week. Rice cookers were used by 13% of households, most commonly in Hawaii (74%), Louisiana (29%), and California (26%).
We collected the 2020 RECS household energy-use data from 18,496 households, which is the largest responding sample in the program’s history. Respondents completed the survey using self-administered web or mail questionnaires during late 2020 and early 2021. For the first time in RECS program history, these data are available at the state level for all 50 states and the District of Columbia.
Principal contributor: Ross Beall