
New England natural gas and electricity prices increase on supply constraints, high demand
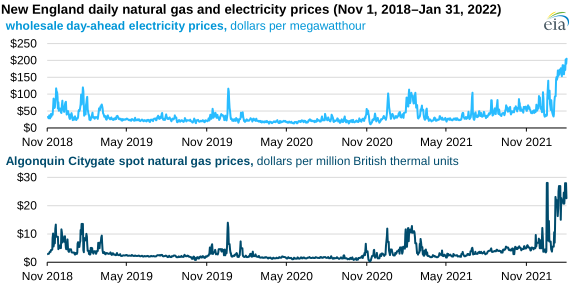
The spot natural gas price at the Algonquin Citygate, a trading hub and the benchmark for the natural gas price in New England, averaged $20.55 per million British thermal units (MMBtu) during January 2022—the highest monthly average price since February 2014—and exceeded $28/MMBtu on several days as part of a pattern of price spikes this winter.
The wholesale day-ahead electricity price in New England also increased; the daily average price rose above $100 per megawatthour (MWh) 25 times in January 2022. Price spikes in New England will likely continue this winter in response to extreme cold weather events because natural gas pipeline supply remains constrained and imports of liquefied natural gas (LNG) remain scarce as the region competes for LNG in a tight global spot market with high prices.
Several factors account for high spot natural gas prices and electricity prices this winter:
- Weather-driven load increases
- Constraints on the region’s interstate natural gas pipelines
- Limited incremental LNG supplies
Weather-driven load increases. During the week ending January 11, natural gas consumption in New England (for both space heating and electric power generation) rose to 4.9 billion cubic feet per day (Bcf/d), according to IHS Markit—the most since January 2021—contributing to high spot natural gas and electricity prices. A cold start to January 2022 has pushed average New England natural gas demand over 4.1 Bcf/d so far this year (January 1–31). Overall natural gas demand in New England is up 13% so far this winter (November 1–January 31) compared with the previous five-season average.
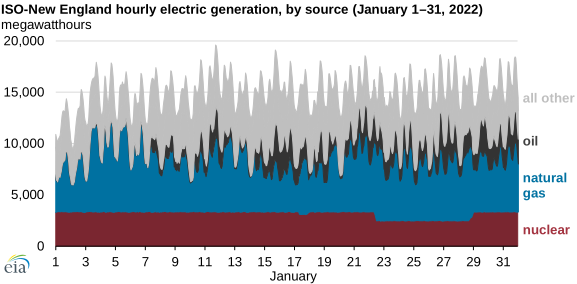
Regional pipeline constraints. From January 7 to 21, 2022, natural gas-fired generation in New England declined 14% compared with the period from December 31 to January 6, according to our Hourly Electric Grid Monitor. Natural gas pipeline constraints limited the amount of natural gas that could be delivered to power plants, leading to the reactivation of several power plants that burn fuel oil to help meet electricity demand. Oil-fired generation has accounted for as much as 20% of New England’s electric supply during several hourly intervals since January 7. New England has not used substantial amounts of fuel oil to meet electricity loads since January 2018, during a bomb cyclone winter storm.
Limited incremental LNG supply. Limited LNG availability has also contributed to higher natural gas prices in New England this winter. End users in New England have to compete for LNG in a tight global market with currently high spot prices. On peak demand days, LNG contributes up to 35% of New England’s natural gas supply. In January, the natural gas spot price averaged $21/MMBtu at the Algonquin Citygate, $28/MMBtu at the Title Transfer Facility in Europe, and $29/MMBtu in Asia. In previous winters, LNG imports moderated the spot price in New England and had limited price spikes.
Principal contributors: Chris Peterson, Mark Morey, Victoria Zaretskaya