
California was the largest net electricity importer of any state in 2019
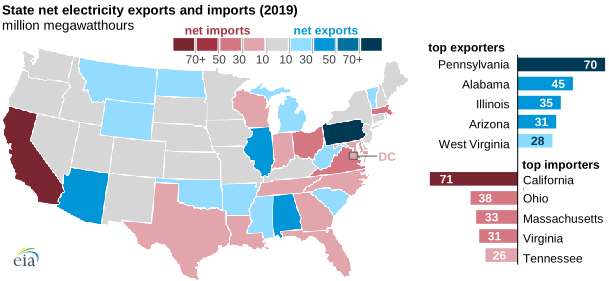
Electricity routinely flows between the Lower 48 states and, to a lesser extent, between the United States and Canada and Mexico. Electricity generation exceeds electricity consumption in 25 states, and excess electricity is transmitted across state lines—almost 10% of U.S. electricity generation is traded among states. In 2019, California’s net electricity imports were the largest in the country at 70.8 million megawatthours (MWh), or 25% of the state’s total electricity supply. Pennsylvania’s electricity exports were the largest of any state in 2019, at 70.5 million MWh, or 24% of total supply.
California utilities partly own and import power from several power plants in Arizona and Utah. In addition, California’s electricity imports include hydroelectric power from the Pacific Northwest, largely across high-voltage transmission lines running from Oregon to the Los Angeles area.
Pennsylvania’s electricity generation was the third-largest in the nation, behind those of Texas and Florida. Natural gas-fired and nuclear power plants produced the majority of Pennsylvania’s in-state electricity in 2019, at 43% and 36%, respectively. Pennsylvania ranks second in the nation, after Illinois, in nuclear power generating capacity.
Although Ohio is in the top 10 states for electricity generation, it was the second-largest electricity importer in 2019. Ohio’s large population, heavily industrial economy, and wide seasonal temperature variation create high electricity demand, which at times exceeds in-state generation.
The U.S. Energy Information Administration’s (EIA) State Electricity Profiles provide data on interstate electricity trade and international imports and exports. EIA calculates net interstate electricity trade by subtracting total reported retail electricity sales, direct use, international exports, and estimated line losses from the total electricity supply.
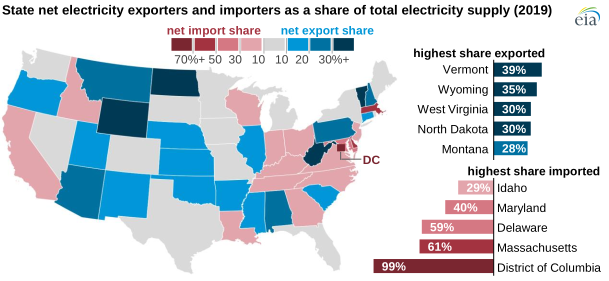
In 2019, electricity exports from Vermont accounted for the largest share of its total electricity supply. Electricity flows from Canada into Vermont and continues on to other states, such as Massachusetts. States that imported the majority of their total electricity supply tended to be smaller, more population-dense states such as Massachusetts. Conversely, states that exported the majority of their total electricity supply tended to be geographically large, low-population density states such as Wyoming.
Four of the five largest exporters, by percentage of total supply, produced more than half of their in-state electricity from coal, ranging from 51% in Montana to 91% in West Virginia. Wyoming is the nation’s largest coal-producing state; West Virginia, Montana, and North Dakota are also major coal producers. Renewables were the second-largest source after coal in Wyoming, West Virginia, North Dakota, and Montana. Nearly all (99%) of Vermont’s in-state electricity generation in 2019 came from renewable sources, largely from hydropower.
Although EIA data do not show which fuel sources were used to generate electricity traded between states, the generation profiles of exporting states in the State Electricity Profiles provide an estimate of the fuel mix for exported electricity.
Principal contributors: Sara Hoff, Marc Harnish
Tags: electricity, exports/imports, California, states, map