
Crude oil tanker rates are likely to remain low until global petroleum demand increases
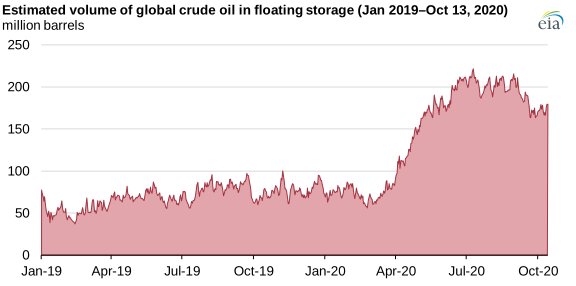
In March and April 2020, reduced demand for crude oil and petroleum products in response to COVID-19 mitigation efforts led to a sharp increase in global crude oil inventories. As onshore inventories increased, market participants turned to using oil tankers to store oil, which is typically more expensive than onshore storage.
The drop in global oil demand and the increased need for floating storage occurred at a time when global crude oil production (specifically from members of the Organization of the Petroleum Exporting Countries, or OPEC) and demand for crude oil tankers was high, driving up tanker rates. Tanker rates have declined since mid-May because global crude oil production and demand are now more balanced.
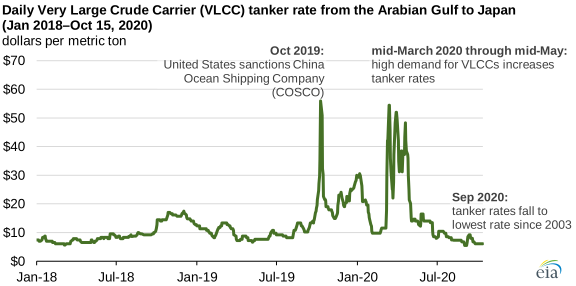
Tanker rates from the Arabian Gulf to Japan, one of the key global tanker routes, spiked in mid-March 2020 and remained elevated through mid-May. Except for a brief increase in tanker rates in October 2019 as a result of U.S. sanctions on Chinese shipping firm COSCO (China Ocean Shipping Company), the price in mid-March 2020 was the highest since at least 2000.
A significant portion of the estimated global stock build that occurred between March and July was the rising volumes of crude oil in floating storage. Estimates from ClipperData indicate that global crude oil floating storage increased this year from 66 million barrels on March 1 to 222 million barrels on July 9. ClipperData’s estimates of crude oil in floating storage include tankers that were loaded at a crude oil export facility and have been anchored or have been drifting slowly for at least seven days in an offshore area where idle ships tend to congregate. These estimates of crude oil in floating storage include crude oil and petroleum liquids that may be designated for a port or refinery but cannot be offloaded because of port congestion.
Crude oil production cuts from OPEC and partner countries (OPEC+), which started in May 2020, decreased the demand for crude oil shipping and floating storage. In September 2020, tanker rates on the Arabian Gulf-to-Japan route fell to $5.50 per metric ton, the lowest rate since 2003.
In the October STEO, EIA forecasts that global petroleum liquids consumption through 2021 will remain lower than 2019 levels. Future demand for petroleum products remains highly uncertain as COVID-19 infection rates rise in a number of countries.
EIA recently published a more detailed discussion of tanker storage rates in This Week in Petroleum.
Principal contributor: Matt French