
Solar photovoltaic generators receive higher electricity prices than other technologies
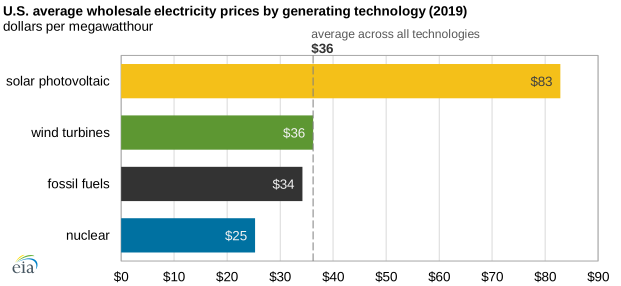
In 2019, the average U.S. wholesale price for electricity generated by solar photovoltaic (PV) technology was significantly higher than average wholesale prices for electricity from other technologies. The weighted average wholesale price for solar PV-generated electricity was $83 per megawatthour (MWh) in 2019, more than double the price paid to producers for electricity generated by wind, fossil fuels, or nuclear. The higher average wholesale price for solar PV relative to other technologies is partly driven by geography and timing.
Wholesale electricity prices are the prices that electricity retailers, such as utilities, pay electricity producers, such as power plant owners and operators. In wholesale markets, the price of electricity changes based on changes in electricity demand, the price of fuels that power plants use to generate electricity, and the availability of the generation fuel sources. These prices are calculated as the revenue that generators receive in wholesale power markets divided by their technologies’ electricity generation and do not reflect the cost of building the power plants or the cost of generating electricity.
About one-third of all U.S. solar PV capacity is located in California, where the average wholesale electricity price across all technologies was $74/MWh in 2019, more than double the national average of $36/MWh. The weighted average wholesale solar PV price in California was $100/MWh, or more than 20% higher than the national average for solar PV. Because California had the most PV capacity in the country, the state’s higher wholesale electricity prices contributed to solar PV’s higher national average price.
Wind wholesale prices are similarly affected by geography. Wind-powered electricity tends to be generated in markets with relatively lower wholesale electricity prices.
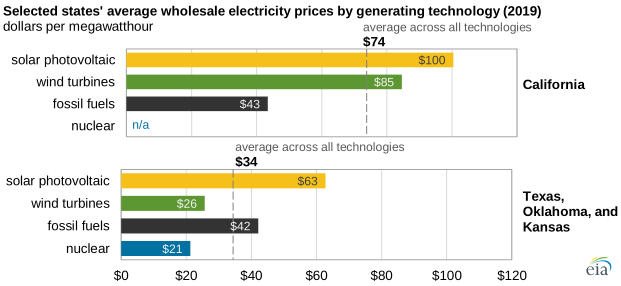
Wind farms in Texas, Oklahoma, and Kansas collectively produced 45% of total U.S. wind generation in 2019. The average wholesale wind price in these states was $26/MWh compared with $47/MWh for wind generation in all other states. Wholesale wind prices in Texas, Oklahoma, and Kansas tend to be lower because their favorable wind resources lower wind generation costs.
Wholesale electricity prices are generally higher when electricity demand within an area is greater. Because consumer demand for electricity varies throughout the day, the time of day when generation occurs also influences wholesale prices. Solar PV only generates electricity in the daytime, when electricity demand and wholesale power prices tend to be higher, but wind turbines generate electricity whenever the wind blows and tend to reach their greatest output overnight. In 2019, more than half of wind generation occurred at night, resulting in lower average wholesale prices for wind-powered electricity than solar-powered electricity.
Principal contributor: Eric Harrison
Tags: prices, generation, electricity, solar, wholesale prices