
Natural gas markets remain regionalized compared with oil markets
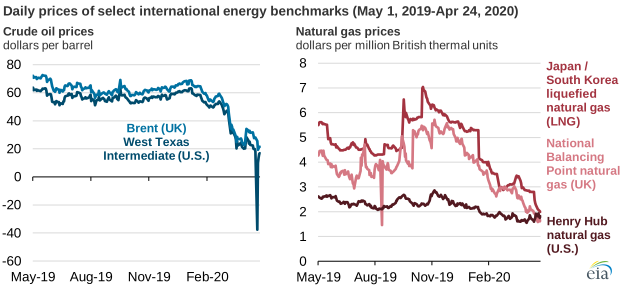
Crude oil markets respond quickly and often dramatically to world events, but natural gas markets have tended to be driven by regional factors and have been less connected to the international market.
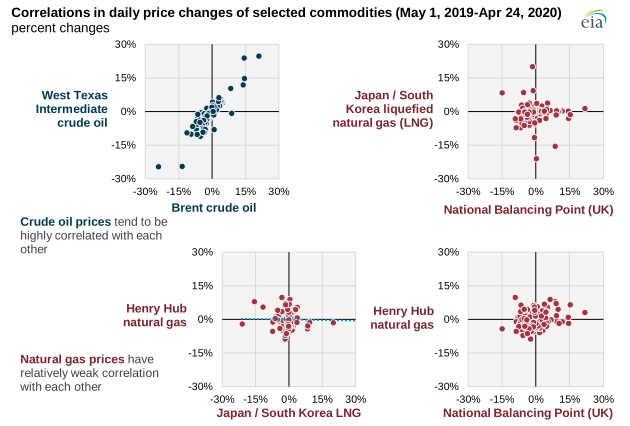
One indication of this difference between these markets is the correlation, or co-movement, of daily prices. Measures of correlation range between positive one, indicating a very strong relationship for movements in the same direction, to negative one, indicating a strong relationship for movements in opposite directions. A zero correlation indicates little or no relationship. The prices do not have to be the same or even close to one another to be highly correlated.
The correlation of daily price movements between West Texas Intermediate (WTI) and Brent for the past year was 0.44, indicating a positive connection between these crude oil benchmark prices. This number is typically higher than 0.90, indicating a strong positive relationship, but recent volatility in the spread between WTI and Brent has lowered the number for the year. In comparison, the daily returns for the international natural gas benchmarks U.S. Henry Hub, Asia’s Japan/Korea LNG (JKM), and the UK National Balancing Point (NBP) show little correlation.
Comparing the crude oil benchmarks WTI and Brent to the international benchmarks for natural gas also shows little correlation at present, which is significant because natural gas contract prices were historically determined, at least in part, by the price of crude oil, and many current contracts still contain that link to varying degrees.
Most crude oil is traded on short-term contracts based on spot prices, and refiners generally purchase crude oil for processing 90 days in advance. Although there are differences among crude oils, such as density and sulfur content, that help determine price differentials, some refiners (those that have more complex processing units) can switch between lighter and heavier crude oils when necessary. By comparison, the quality of natural gas is standardized as it enters the pipeline delivery system. Events that lead to crude oil shortages or surpluses in one region can quickly affect prices and can create arbitrage opportunities to move crude oil to and from other regions. Crude oil is primarily transported by tanker or pipeline.
Natural gas is predominately transported through pipeline systems because of its gaseous state. When converted to liquefied natural gas (LNG) through cryogenic processing, natural gas can be shipped by tanker overseas. However, the liquefaction process is expensive, and LNG requires specially designed tankers to maintain cryogenic integrity (in other words, tankers that have tanks capable of limiting re-vaporization and product loss while in transit). Although the cost of transporting crude oil is usually a fraction of the crude oil cost, the cost of liquefying and transporting natural gas in the form of LNG can, in some cases, cost as much or more than input cost of the natural gas.
The high cost and logistics of transporting natural gas have hindered natural gas trade in the past and helped to keep regional markets isolated. However, rising global demand for natural gas has led to increases in both the number of LNG importers and exporters. The growth in LNG trade has contributed to an increasing volume of natural gas traded on a short-term or spot basis, which increased to 34% of volume traded in 2019.
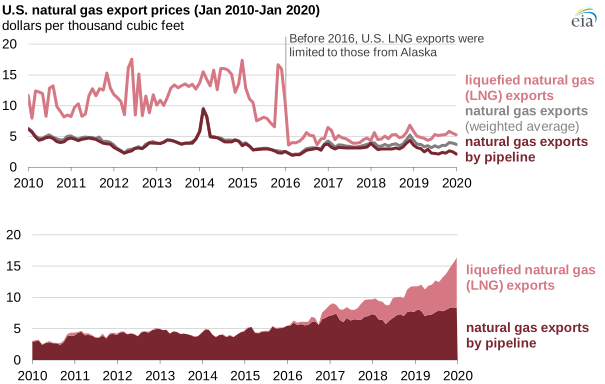
The growth in spot market liquidity will contribute to a gradual shift away from long-term, oil-linked contract pricing toward more short-term, spot-based transactions. This shift will likely lead to a more integrated global natural gas market. Growing U.S. export capacity will contribute to this transition. Rising U.S. production has led to significant increases in U.S. LNG exports.
Principal contributor: Justin Parker