
The United States is projected to be a net exporter of crude oil in two AEO2020 side cases
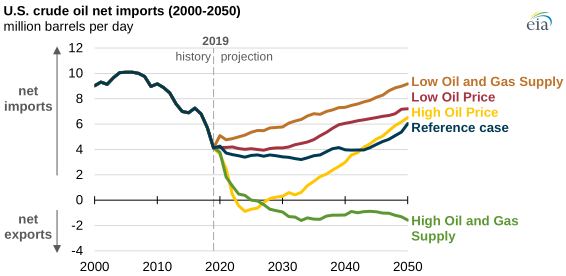
The U.S. Energy Information Administration (EIA) projects that the United States will export more crude oil and petroleum products combined than it imports (net exporter) until 2050, but under certain conditions, it could become a net exporter of crude oil on its own in the future as well. EIA’s Annual Energy Outlook 2020 (AEO2020) includes two side cases—one with more oil and gas supply and one with higher oil prices—in which the United States becomes a net crude oil exporter within the next decade.
In the AEO2020 Reference case, which reflects current laws and regulations, EIA projects that the United States will remain a net importer of crude oil through 2050, despite domestic crude oil production increases in the coming years. The United States produced about 12 million barrels per day (b/d) in 2019; in the Reference case, EIA expects U.S. crude oil production to plateau at 14 million b/d in the mid-2020s and then begin to decline in the mid-2040s.
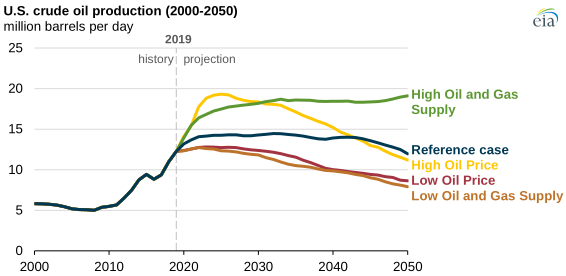
In the AEO2020 High Oil and Gas Supply case, which includes assumptions for more domestic crude oil resources, the United States becomes a net crude oil exporter starting in 2025 and maintains that status through 2050. In this case, U.S. crude oil production gradually increases from 12 million b/d in 2019 to 18 million b/d in 2026 and remains higher than that level through 2050.
In the AEO2020 High Oil Price case, the United States becomes a net exporter of crude oil starting in 2023, but it only maintains that status through 2027. In this case, the United States returns to being a net importer of crude oil after 2027 as U.S. crude oil production declines. The initial increase in crude oil production is steepest in this case, reaching 19 million b/d in 2025, but then declines through the rest of the projection period. In this case, the United States produces less than 12 million b/d of crude oil by the late 2040s. Relatively quick development limits technological improvements that occur over time, ultimately leading to a decline in production.
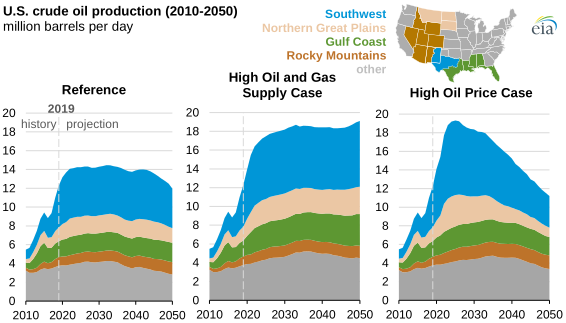
Recent growth in U.S. crude oil production has been driven by the development of tight oil resources, primarily in the Southwest, which includes the Permian Basin that spans parts of western Texas and eastern New Mexico. EIA expects development to continue in the Southwest: in the Reference case, 37% of cumulative U.S. crude oil production between 2020 and 2050 originates from this region. Although production volumes vary across regions in the side cases, the Southwest still accounts for 37% of cumulative crude oil production from 2020 to 2050 in the High Oil and Gas Supply and High Oil Price cases.
Principal contributors: Corrina Ricker, Albert Painter