
EIA projects total U.S. energy-related CO2 emissions to be relatively flat through 2050
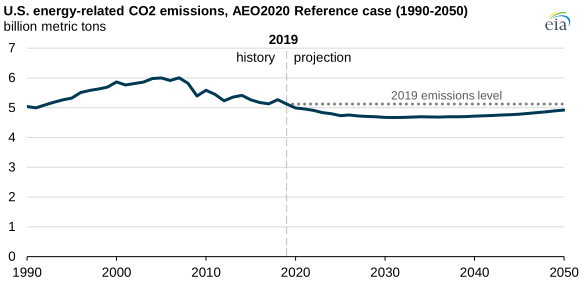
In the U.S. Energy Information Administration’s (EIA) Annual Energy Outlook 2020 (AEO2020) Reference case, which assumes no new laws and regulations, U.S. energy-related carbon dioxide (CO2) emissions decrease through the early 2030s before increasing to 4.9 billion metric tons in 2050. If realized, U.S. energy-related CO2 emissions in 2050 would be 4% lower than 2019 levels. Changes in the fuel mix for electricity generation and increasing activity in the industrial and transportation sectors are the main drivers of EIA’s U.S. energy-related CO2 emissions projections.
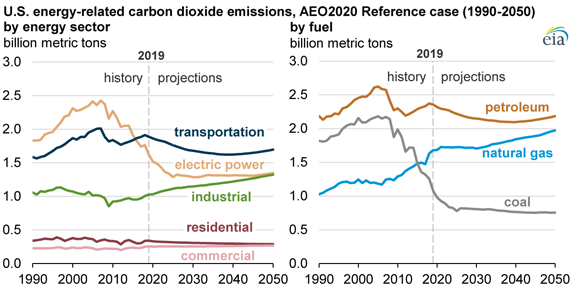
Total U.S. energy-related CO2 emissions decrease until 2031, then slowly increase. The U.S. electric power sector’s CO2 emissions experience the largest drop through 2025 as a result of coal power plant retirements and additions in renewable generation capacity. Beyond the coal-driven CO2 emissions decrease from 2019 to 2025, electric power sector CO2 emissions stay relatively constant throughout the projection period as the more economically viable coal power plants remain in service.
In addition, CO2 emissions in the U.S. transportation sector decrease through the late 2020s. Rising fuel efficiency more than offsets the effects of increases in total travel and freight movements, and therefore petroleum-based energy consumption in the transportation sector decreases.
Total U.S. energy-related CO2 emissions resume growth after 2031 but remain 4% lower than 2019 levels by 2050. Increased activity in the transportation and industrial sectors leads to more consumption of petroleum and natural gas. Residential and commercial energy sector emissions remain largely unchanged throughout the projection period.
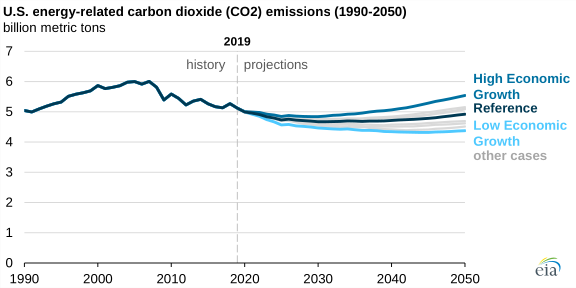
Other scenarios included in AEO2020 demonstrate the sensitivity of U.S. energy-related CO2 emissions projections to assumptions regarding variables such as economic activity, oil prices, renewable energy technology costs, and oil and natural gas resource estimates. Of the side cases in the AEO2020, energy-related CO2 emissions vary the most in the cases that modify economic growth assumptions. By 2050, CO2 emissions in the High Economic Growth case are 13% higher than in the Reference case (and 9% higher than 2019 levels). CO2 emissions in the Low Economic Growth case are 11% lower than in the Reference case and 15% lower than 2019 levels.
More information on EIA’s U.S. energy-related CO2 emission projections—including carbon intensity and energy intensity trends—is available in the full AEO2020, specifically in the chapter about emissions. EIA also recently released additional analysis on U.S. energy-related CO2 emissions in 2018.
Principal contributor: Andri Rizhakov