
Despite the U.S. becoming a net petroleum exporter, most regions are still net importers
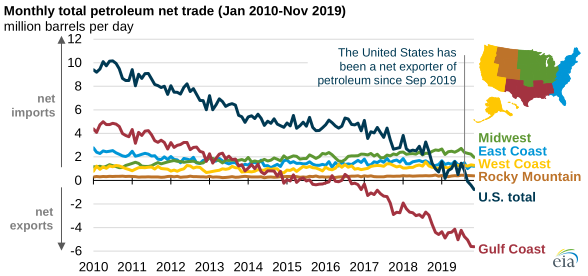
Updated February 6, 2020 at 5:00 p.m. to correct Rocky Mountain petroleum net trade in the first figure.
In November 2019, the United States exported 772,000 barrels per day (b/d) more petroleum (crude oil and petroleum products) than it imported, marking the third consecutive month in which the United States was a net petroleum exporter. Although the United States is a net petroleum exporter as a whole, most regions other than the U.S. Gulf Coast region remain net petroleum importers.
Net petroleum trade is calculated as the total imports of crude oil and petroleum products minus the total exports of crude oil and petroleum products. In September 2019, the United States became a net petroleum exporter for the first time since monthly records began in 1973.
The United States is a net importer of crude oil. In November 2019, the latest monthly data, it imported 5.8 million b/d of crude oil and exported 3.0 million b/d of crude oil. The United States is a net exporter of petroleum products (such as distillate fuel, motor gasoline, and jet fuel). In November 2019, the United States exported 5.8 million b/d of petroleum products and imported 2.2 million b/d of petroleum products.
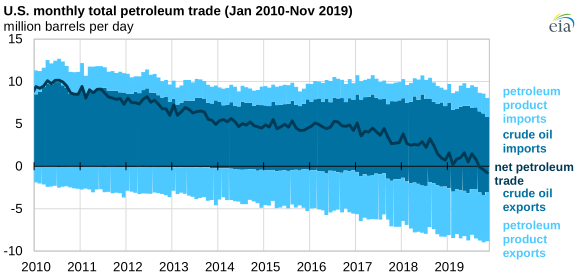
Regional petroleum trade patterns are still determined by geographical factors, existing infrastructure, regional balances of supply and demand, and other constraints—factors that often change slowly. In recent years, significant growth in crude oil output and infrastructure changes to refineries, pipelines, and terminals in the U.S. Gulf Coast region have led to most of the changes in U.S. petroleum trade patterns.
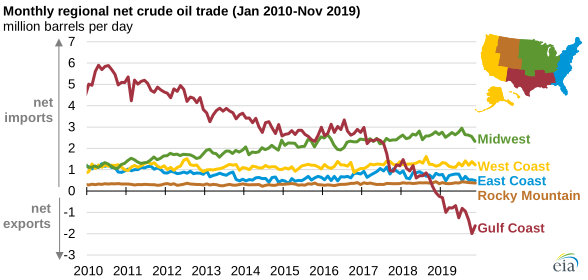
Of the five regions (also referred to as Petroleum Administration for Defense Districts), only the U.S. Gulf Coast currently exports more crude oil than it imports: 2.9 million b/d of exports compared with 1.2 million b/d of imports in November. The Gulf Coast continues to import primarily heavy, high-sulfur crude oil, which most Gulf Coast refineries are configured to process. Imports from Mexico and Canada are nearly tied as the largest sources of Gulf Coast crude oil imports.
Canada is also the largest source of crude oil imports for the Midwest, which is now the largest crude oil importing region; crude oil net imports totaled 2.5 million b/d in November. In other regions, crude oil trade patterns are relatively unchanged.
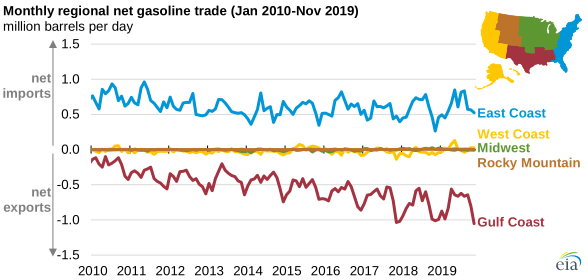
Similar regional differences exist for petroleum products as well. The United States has been a net exporter of motor gasoline on an annual basis since 2016; motor gasoline exports—mostly from the U.S. Gulf Coast—have more than offset motor gasoline imports, especially to the U.S. East Coast.
The U.S. Energy Information Administration’s (EIA) January 2020 Short-Term Energy Outlook forecasts that U.S. petroleum net exports will average 0.8 million b/d in 2020 and 1.4 million b/d in 2021. If these forecasts are realized, the United States would be a net petroleum exporter for the first time on an annual basis in EIA's data series that dates back to 1949. EIA forecasts that the United States will remain a net importer of crude oil in both years, importing a net 3.9 million b/d of crude oil in 2020 and 2.9 million b/d in 2021.
Principal contributor: Mason Hamilton
Tags: exports/imports, liquid fuels, oil/petroleum