
EIA Product Highlight: U.S. Energy Mapping System
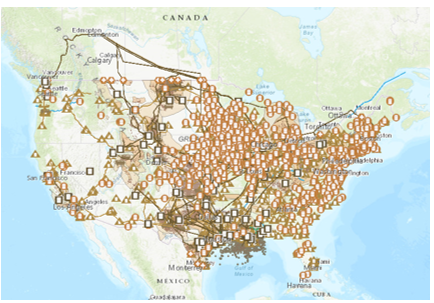
Throughout 2019, the U.S. Energy Information Administration (EIA) continued to update its U.S. Energy Mapping System to include several new map layers. The U.S. Energy Mapping System is an interactive, comprehensive visual reference for energy infrastructure in the United States that shows the locations of energy infrastructure.
Some of these data sets include locations of coal mines, oil and natural gas wells, power plants, pipelines, storage, and many more map layers that users can add to the map individually or in groups. The sources for most of these map layers are EIA surveys or other U.S. government sources, such as the Federal Energy Regulatory Commission, U.S. Geological Survey, U.S. Bureau of Ocean Energy Management, and the Homeland Infrastructure Foundation-Level Data. The map layers that were either created by EIA or based on EIA surveys are also provided as shapefiles so that users can combine them with information from other sources and conduct their own geospatial analysis.
This year, EIA added new map layers that include U.S. railroads and uranium resources. The U.S. railroad layers show freight railroads (Class 1) and other railroads. The uranium resource layers show identified resource areas, uranium associated with phosphate, and NURE (National Uranium Resource Evaluation) favorable areas. EIA also updated map layers for locations of natural gas processing plants, electric substations, oil and natural gas platforms in federal waters, and solar resources.
The U.S. Energy Mapping System is part of a suite of six related interactive map products, including Energy Disruptions, State Energy Profiles, Flood Vulnerability, Major Oil and Gas Plays, and the Gulf of Mexico Fact Sheet. All of these tools have the same interactive capabilities but have different map layers and use different EIA and external sources. EIA has begun a review of its mapping tools to increase interactive capabilities.
Principal contributors: Jim O’Sullivan, Kip Platto
Tags: map