U.S. Energy Information Administration logo
Skip to sub-navigation
November 8, 2019

The U.S. placed near-record volumes of natural gas in storage this injection season
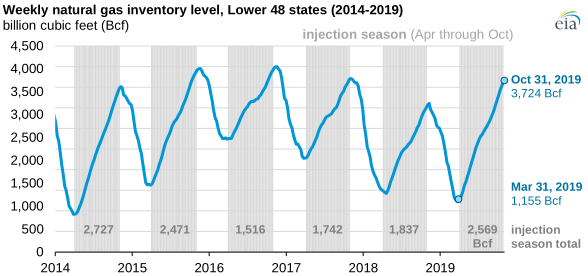
weekly natural gas inventory level
Source: U.S. Energy Information Administration, Natural Gas Monthly and Weekly Natural Gas Storage Report
Note: The data point for October 31, 2018, is an interpolated value based on the Weekly Natural Gas Storage Report.

The amount of natural gas held in storage in 2019 went from a relatively low value of 1,155 billion cubic feet (Bcf) at the beginning of April to 3,724 Bcf at the end of October because of near-record injection activity during the natural gas injection, or refill, season (April 1–October 31). Inventories as of October 31 were 37 Bcf higher than the previous five-year end-of-October average, according to interpolated values in the U.S. Energy Information Administration’s (EIA) Weekly Natural Gas Storage Report.

Although the end of the natural gas storage injection season is traditionally defined as October 31, injections often occur in November. Working natural gas stocks ended the previous heating season at 1,155 Bcf on March 31, 2019—the second-lowest level for that time of year since 2004. The 2019 injection season included several weeks with relatively high injections: weekly changes exceeded 100 Bcf nine times in 2019. Certain weeks in April, June, and September were the highest weekly net injections in those months since at least 2010.
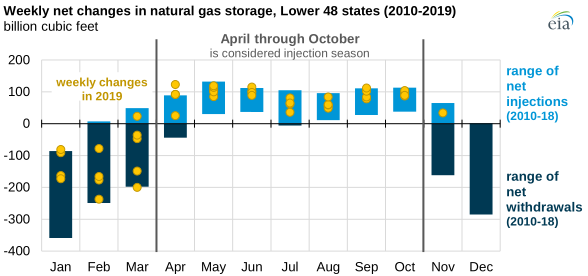
weekly net changes in natural gas storage
Source: U.S. Energy Information Administration, Weekly Natural Gas Storage Report

From April 1 through October 31, 2019, more than 2,569 Bcf of natural gas was placed into storage in the Lower 48 states. This volume was the second-highest net injected volume for the injection season, falling short of the record 2,727 Bcf injected during the 2014 injection season. In 2014, a particularly cold winter left natural gas inventories in the Lower 48 states at 837 Bcf—the lowest level for that time of year since 2003.

Principal contributor: Jose Villar

Statistics
Analysis
Tools
Education
News

Petroleum & Other Liquids

Crude oil, gasoline, heating oil, diesel, propane, and other liquids including biofuels and natural gas liquids.

Natural Gas

Exploration and reserves, storage, imports and exports, production, prices, sales.

Electricity

Sales, revenue and prices, power plants, fuel use, stocks, generation, trade, demand & emissions.

Coal

Reserves, production, prices, employment and productivity, distribution, stocks, imports and exports.

Nuclear & Uranium

Uranium fuel, nuclear reactors, generation, spent fuel.

Renewable & Alternative Fuels

Includes hydropower, solar, wind, geothermal, biomass and ethanol.

EIA Survey Forms

Forms EIA uses to collect energy data including descriptions, links to survey instructions, and additional information.

Total Energy

Comprehensive data summaries, comparisons, analysis, and projections integrated across all energy sources.

U.S. States

State energy information, including overviews, rankings, data, and analyses.

International

International energy information, including overviews, rankings, data, and analyses.

Environment

Greenhouse gas data, voluntary reporting, electric power plant emissions.

Data Tools, Apps, & Maps

Tools to customize searches, view specific data sets, study detailed documentation, and access time-series data.

Open Data

EIA's free and open data available as API, Excel add-in, bulk files, and widgets

EIA Beta

Come test out some of the products still in development and let us know what you think!

Open Source Code

EIA's open source code, available on GitHub.

RSS Feeds

Subscribe to feeds for updates on EIA products including Today in Energy and What's New.