
The United States tends to produce lighter crude oil and import heavier crude oil
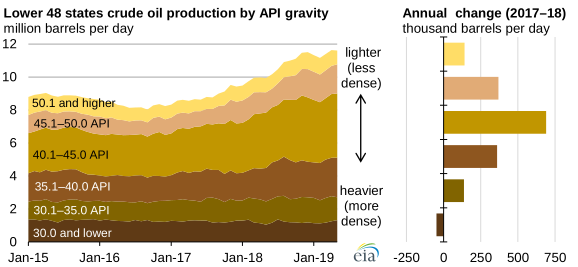
In 2018, total U.S. crude oil production grew by 17%, led by increased production of relatively light, less dense crude oil. The increase in light crude oil production is largely the result of the growth in crude oil production from shale and tight rock formations, which are now more accessible because of improvements in horizontal drilling and hydraulic fracturing.
Crude oil with a higher API gravity is lighter, or less dense. Production of crude oil with an API gravity greater than 40 degrees grew from 1.2 million barrels per day (b/d) in 2015 to more than 5.8 million b/d in 2018. Production in this API range accounted for 55% of total Lower 48 production in 2018, an increase from 50% in 2015, the earliest year for which EIA has crude oil production data by API gravity.
API gravity can differ greatly by production area. For example, oil produced in Texas—the largest crude oil-producing state—has a relatively broad distribution of API gravities, and most crude oil produced there ranges from 30 to 50 degrees API. Relatively light crude oil with an API gravity from 40 to 50 degrees accounted for most Texas production in 2018, at 56%. Crude oil in this API gravity range—the fastest-growing category overall—reached 2.5 million b/d in 2018, driven by increasing production in the tight oil plays of the Permian and Eagle Ford. The crude oil produced in North Dakota’s Bakken formation also tends to be relatively light. Conversely, the crude oil produced in California and the Federal Gulf of Mexico tends to be heavier.
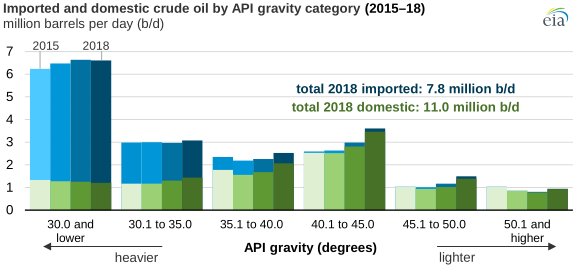
In contrast to the light crude oil that is increasingly produced in the United States, imported crude oil tends to be heavier. In 2018, 7.5 million b/d (97%) of imported crude oil had an API gravity of 40 or lower, compared with 4.7 million b/d (45%) of domestic production.
Although the United States has been producing record levels of domestic crude oil, it continues to import crude oil because of variations in crude oil quality. API gravity, along with sulfur content, determines the type of processing needed to refine crude oil into fuel and other petroleum products, all of which factor into refineries’ profits. Overall U.S. refining capacity is geared toward a diverse range of crude oil inputs, so it can be uneconomic to run some refineries solely on light or heavy crude oil.
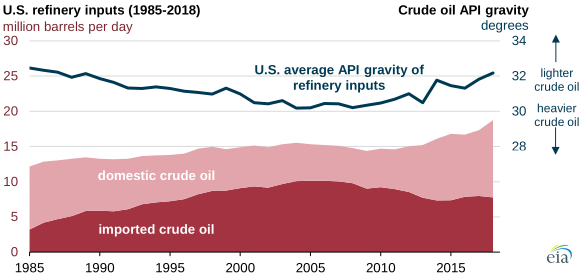
The API gravity of domestic and imported crude oil used in U.S. refineries has increased from a low of 30.2 degrees in 2004 to an average of 32.2 degrees in 2018. Since 2008, U.S. imports of crude oil have decreased 21%. During the same time period, domestic production grew 120% and consequently provided a greater share of refinery inputs.
EIA publishes API gravity production data by state in the Monthly Crude Oil and Natural Gas Production report. EIA also reports company-level crude oil import quality to better inform analysis of refinery inputs and utilization, crude oil trade, and regional crude oil pricing.
Principal contributor: Emily Geary