
In 2018, foreign-sourced uranium accounted for 90% of U.S. nuclear operators’ purchases
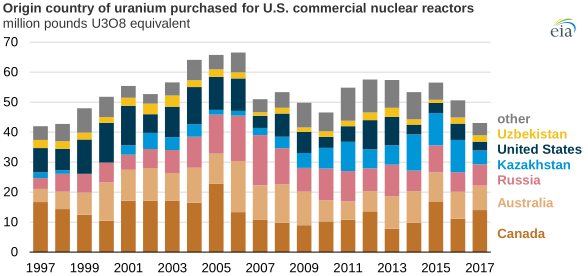
Most uranium purchased by U.S. civilian nuclear power reactor operators every year comes from foreign countries. In 2018, 90% of the 40 million pounds of uranium purchased was from foreign countries, led by Canada (24% of total), Kazakhstan (20%), Australia (18%), and Russia (13%). U.S.-origin uranium accounted for 10% of purchases, or 3.9 million pounds. Since 2010, between 83% and 94% of uranium purchases in any single year have come from foreign countries.
Canada was the largest source of uranium purchased by U.S. civilian nuclear power reactor operators in 2018 for the fourth year in a row. Canada, home to large, high-quality uranium reserves, has been the second-largest uranium producer in the world after Kazakhstan since 2009.
Uranium concentrate (U3O8) production and employment in the uranium industry in the United States have fallen for the past several years. U.S. uranium production totaled 1.6 million pounds of U3O8 in 2018, the lowest annual total since 1950 and a 66% decrease from the 4.9 million pounds of U3O8 produced in 2014.
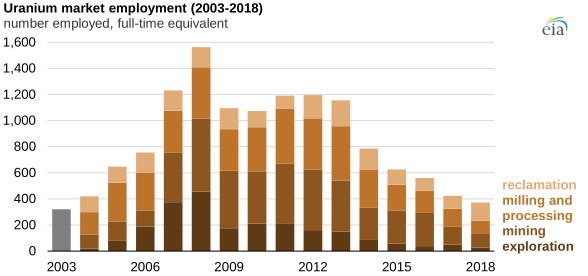
Note: Employment in 2003 is not available by category.
According to uranium market employment data—which includes exploration, mining, milling and processing, and reclamation activities—full-time equivalent employees declined to 372 in 2018, the lowest total since 2003, when they totaled 321. Employment increased every year from 2004 to 2008 as uranium prices rose, peaking at 1,563 employees in 2008. Industry employment has now fallen in every year from 2012 to 2018.
Exploration employment has seen the largest decline since 2008, down 94% from 457 full-time equivalent employees to only 27 in 2018 because persistently low uranium prices offer little incentive to explore more potential mining sites. Mining employment is down 80% from 2008 levels, from 558 employees to 110 employees in 2018.
The only category where employment hasn’t declined is reclamation, which increased to 138 employees in 2018, up from 100 in 2017. Reclamation activities have increased because more formerly active properties are being restored to a more natural state after onsite resources are exhausted or sites become uneconomic to operate.
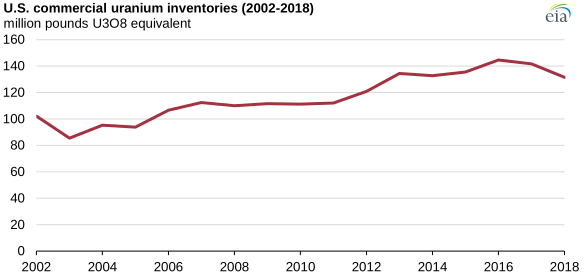
After peaking at 145 million pounds in 2016, U.S. commercial uranium inventories have since fallen to 131 million pounds in 2018. Commercial uranium inventories include material at all points in the nuclear fuel cycle.
Principal contributor: Tim Shear