
Liquefied natural gas imports limited price spikes in New England this winter
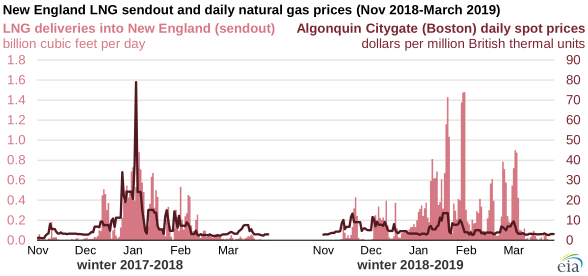
Note: Includes daily natural gas sendout from Everett LNG, TGP Distrigas receipt, Northeast Gateway, and Canaport.
During winter 2018–2019, imports of liquefied natural gas (LNG) at terminals serving New England played an important role in moderating natural gas prices in the region. LNG imports are regasified at these terminals and then sent to natural gas distribution networks. These sendout volumes increased during times of high spot natural gas prices at the Algonquin Citygate, a widely referenced trading hub and benchmark for natural gas prices in New England, effectively limiting further increases in spot prices.
Spot natural gas prices in New England are more volatile during winter months when cold weather contributes to rising regional natural gas demand and leads to more congestion on the natural gas pipeline network. Because New England does not have underground natural gas storage infrastructure and is not a natural gas-producing region, LNG imports to the region can be a key marginal source of natural gas supply during times of high natural gas demand in the winter.
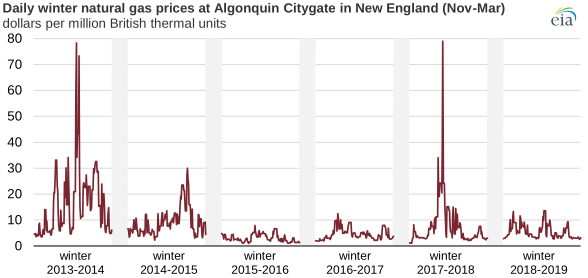
During the bomb cyclone event in early January 2018, spot natural gas prices at Algonquin Citygate spiked to nearly $80 per million British thermal units (MMBtu) on January 4, 2018. During the most recent winter, daily prices at Algonquin Citygate remained lower than $14/MMBtu and averaged about $7/MMBtu in January and February.
New England receives LNG imports from three regional regasification facilities: the Canaport LNG onshore terminal (1.0 billion cubic feet per day (Bcf/d) capacity) in New Brunswick, Canada; the Everett LNG onshore terminal (0.7 Bcf/d capacity), near Boston, Massachusetts; and the Northeast Gateway Deepwater Port offshore terminal (0.4 Bcf/d capacity), also near Boston.
From November 2017 through March 2018, LNG imports into New England averaged 0.14 Bcf/d and peaked at 0.88 Bcf/d on January 6 during the bomb cyclone event. From November 2018 through March 2019, LNG imports into New England averaged 0.24 Bcf/d and peaked at 1.48 Bcf/d on February 1.
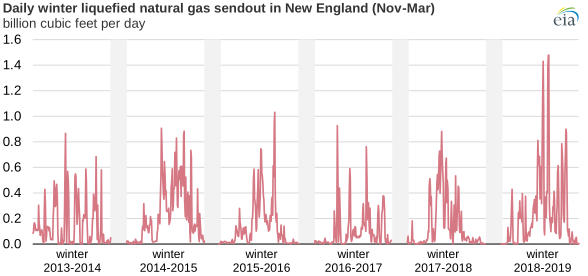
Note: Includes daily natural gas sendout from Everett LNG, TGP Distrigas receipt, Northeast Gateway, and Canaport.
Increased LNG imports were not the only factor that contributed to moderating spot natural gas prices in New England during winter 2018–2019. Cold weather events last winter were more episodic compared with the sustained cold weather in the polar vortex event in January 2014 and the bomb cyclone event of January 2018.
EIA’s New England Dashboard, launched earlier this year, includes visualizations of several key indicators for New England’s natural gas and electricity markets using data series from EIA and third-party sources.
Principal contributors: Victoria Zaretskaya, Chris Peterson