
The Middle East, Africa, and Asia now drive nearly all global energy consumption growth
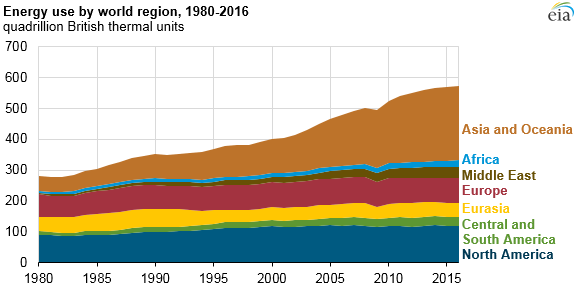
Energy consumption in Asia, the Middle East, and Africa continues to grow rapidly, with about 20% growth in each region between 2010 and 2016, according to newly available data in EIA’s International Energy Statistics database. In particular, energy consumption has been increasing in the Middle East and Africa, driven by economic growth, increased access to energy markets, and quickly growing populations. Energy consumption in Asia grew even as energy consumption in China declined between 2015 and 2016.
Although growth was rapid in Africa and the Middle East, Asia and Oceania consumed much more energy overall (42% of 2016 world energy consumption, compared with 6% in the Middle East and 3% in Africa). Slower long-term energy consumption trends continued in the mature economies of North America, where energy consumption grew by 1% between 2010 and 2016, and in Europe, where energy consumption actually fell 4% between those years.
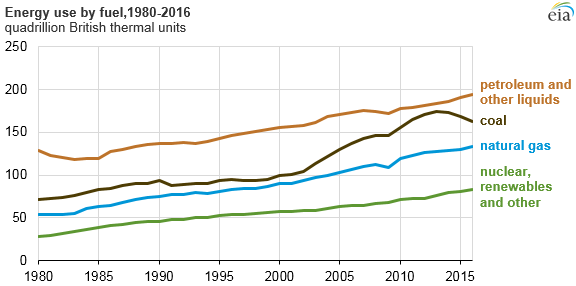
Globally, petroleum and other liquid fuels (including biofuels such as ethanol and biodiesel) are the most prevalent form of energy consumed. Growing use of these fuels has been supported by increasing supplies of U.S. shale oil and other international sources of liquid fuels that have kept prices relatively competitive. Global coal consumption continued to decline as a result of competition from low cost natural gas as well as some countries’ policies to limit or decrease coal use.
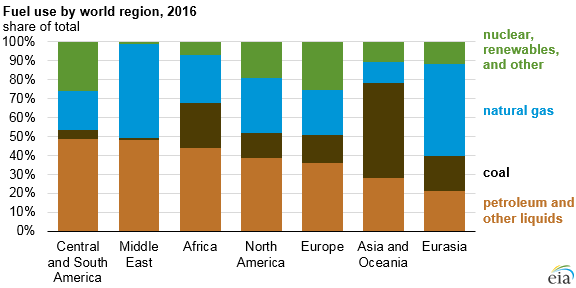
Regional fuel use varies according to the availability of resources. In 2016, coal accounted for almost 50% of the energy consumed in Asia and Oceania, where China, India, and Australia are all significant consumers of coal. The largest shares of nuclear and renewable energy were in Europe (26%), North America (19%), and Central and South America (26%).
These regions, particularly Europe and North America, have significant renewable resources as well as policies that encourage renewable energy usage, especially wind and solar. Because of the region’s rich reserves of oil and natural gas, nearly all energy consumption in the Middle East comes from either petroleum or natural gas with virtually no contribution from coal, nuclear, or renewable energy.
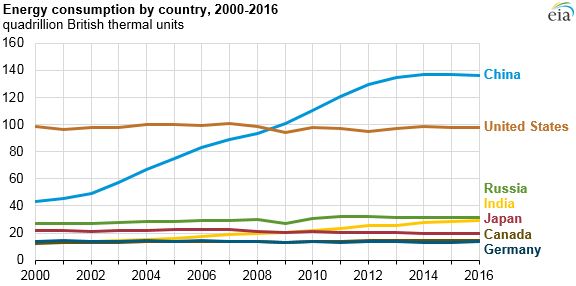
From 2000 to 2013, China experienced rapid growth in energy consumption, overtaking the United States as the world’s largest energy consumer in 2009. Since 2013, China has consistently used approximately 40% more energy than the United States. Although growth in China’s gross domestic product (GDP) has slowed over this time period, it continues to grow faster than 6% per year compared with relatively flat total energy consumption, demonstrating the country’s improvements in energy intensity (GDP per unit energy).
By comparison, India’s GDP is growing at a rate of almost 8% per year, and energy use is growing as well. In recent years, India has surpassed Japan, Canada, and Germany in energy consumed. As more recent data become available, India is likely to surpass Russia as the third-highest energy consuming country.
Detailed country-level data on energy production, consumption, and transport through 2016 are available in EIA’s International Energy Statistics database. Natural gas data, petroleum supply data, GDP, and population are available through 2017. EIA Country Analysis Briefs supplement the International Energy Statistics database with key information on energy production and consumption trends.
Principal contributor: Ari Kahan