
Electricity residential retail choice participation has declined since 2014 peak
Republished January 17, 2019, to correct the map.
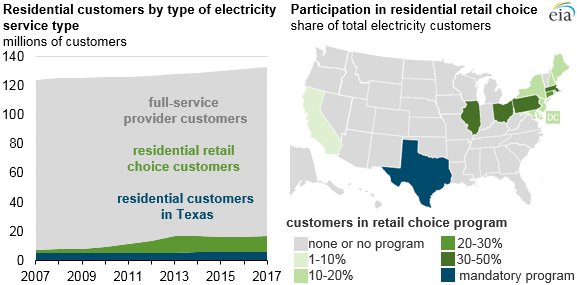
In states with residential retail choice programs, customers can elect to purchase their electricity directly from their choice of energy suppliers, with the electricity delivered to them by their local utility. The number of customers participating in retail choice programs peaked at 17.2 million customers (13% of total residential customers) in 2014 and has since declined, reaching 16.2 million customers (12% of the national total) in 2016 and 16.7 million customers (13% of the national total) in 2017.
Currently, 13 states and the District of Columbia have active, statewide residential retail choice programs. In Texas, the retail choice program is mandatory under state law in the part of the state operated by the Electric Reliability Council of Texas (ERCOT). Retail customers in ERCOT, which covered 87% of residential customers in the state in 2017, must either choose a competitive supplier or be assigned one. Four other states—Michigan, Nevada, Oregon, and Virginia—each have a form of limited retail choice that is mostly available to non-residential customers.
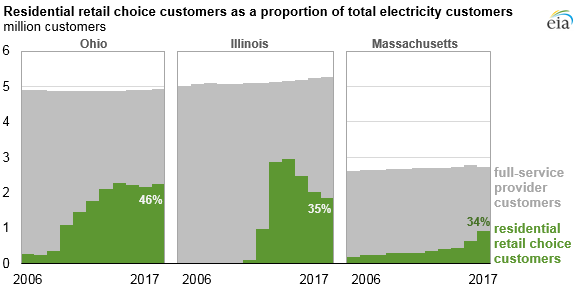
Outside of Texas, Ohio has the highest number of residential retail choice customers, followed by Illinois and Massachusetts. These three states have had varying experiences with program participation during the past decade. In recent years, Massachusetts has seen steady growth in retail choice participation, while conditions in Ohio have caused participation to level off and in Illinois to decline.
To help utilities ease into the new market, Ohio started deregulating its electricity industry in 1999 and launched a full retail market after an almost 10-year testing phase. At the same time, FirstEnergy in Ohio sought to do away with a long-standing discount from the 1970s that benefited households with electric heating systems.
As of 2009, FirstEnergy limited the program to only existing households and slowly raised rates for these customers during the next decade. This near-simultaneous shift in prices and the launch of the market most likely led to the sharp increase in residential retail choice customers in 2009. Since this early growth, retail choice in Ohio, although still popular among residential customers, has slowed and even seen a small decline in recent years.
Between 2009 and 2013, Illinois had one of the highest growth rates in retail customer choice among residential customers, in part because of municipal aggregation and a steep drop in natural gas prices. Municipal aggregation allows a municipality or community to participate in retail choice programs by negotiating competitive electricity rates as a large group from retail power marketers. Lower natural gas prices reduced generation costs, which in turn helped suppliers offer competitive pricing to residential customers.
Following extreme cold weather in January 2014, FirstEnergy Solutions, a major retail power marketer in both Illinois and Ohio, announced it would impose a one-time surcharge of $5 to $15 on all Illinois and Ohio customers to cover extra costs billed in the PJM regional transmission area. This surcharge led to a broad investigation by the Public Utilities Commission of Ohio, and ultimately, FirstEnergy Solutions decided to exclude its almost three million residential customers from the charge.
After this event, residential customers in Illinois switched back to their full-service providers at a rate of 16% in 2015 and 18% in 2016. As of 2017, retail choice providers serviced 35% of total residential customers in Illinois, down from the peak of 57% in 2014. In Ohio, the switchback rates were lower at 3% and 2% in 2015 and 2016, respectively.
Principal contributor: Kimberly Palacios