
U.S. home heating bills likely to be slightly higher this winter
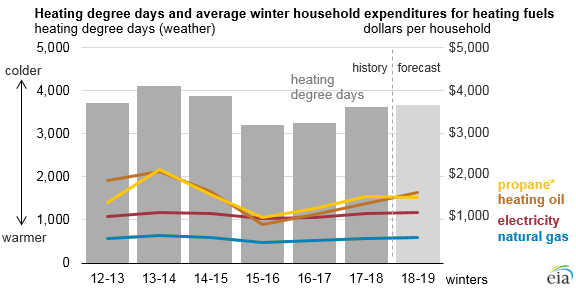
Note: The propane price is the weighted average of Midwest and Northeast prices. Prices for all other fuels reflect national averages.
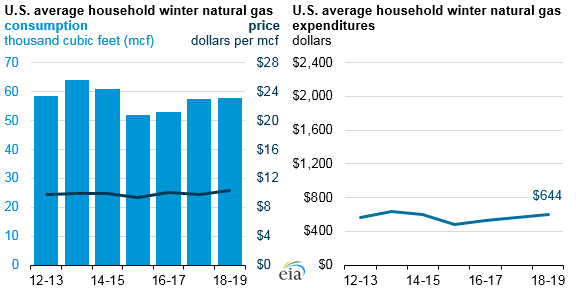
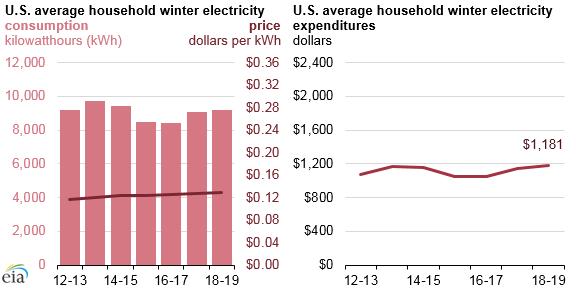
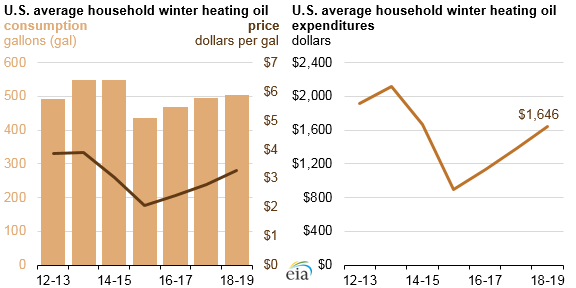
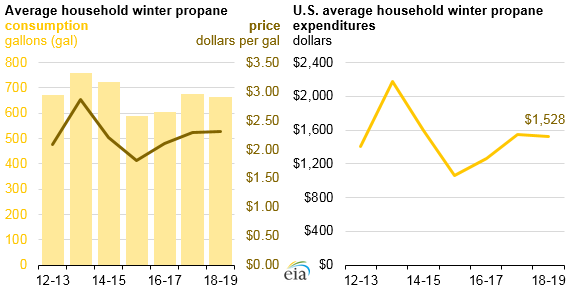
Most U.S. households can expect higher heating expenditures this winter (October through March) compared with last winter according to EIA's Winter Fuels Outlook. Higher expected winter heating expenditures are mainly the result of higher prices for heating fuels, as temperatures are expected to be similar to last winter in much of the country. More information about EIA’s expectations for winter fuels prices and expenditures is available in the Short-Term Energy Outlook supplement on winter fuels, released at noon today.
EIA’s short-term projections of heating demand are based on the most recent temperature forecasts from the National Oceanic and Atmospheric Administration (NOAA). NOAA’s forecast anticipates that the 2018–2019 winter will be 1% colder than last winter, which is close to the average of the previous 10 winters. Expenditures for Midwest households using propane as their primary heating source are expected to decline because the Midwest, the region with the highest concentration of propane heating, is the only region expected to have warmer weather this winter.
Because weather creates great uncertainty in winter energy forecasts, EIA's Winter Fuels Outlook includes projections for 10% colder and 10% warmer scenarios. In the past 10 winters, actual temperatures compared with NOAA’s September forecast have been more than 10% colder once and more than 10% warmer three times.
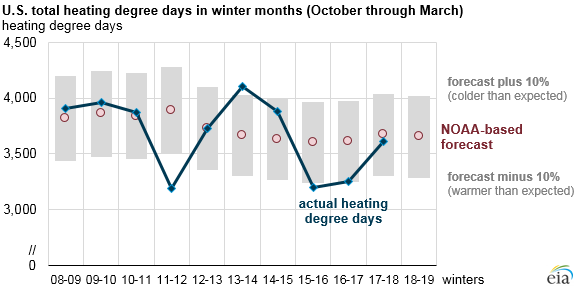
The average household winter heating fuel expenditures in EIA’s forecast provide a broad guide to expected heating expenditures. Fuel expenditures for a particular household will also depend on the size and energy efficiency of that home and its heating equipment, indoor temperature preferences, and local weather conditions.
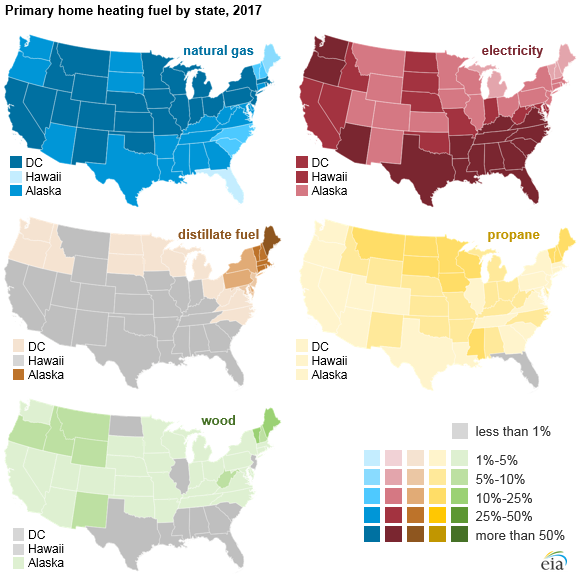
The choice of primary heating fuel varies considerably by region, contributing to regional differences in total expenditures. Natural gas is the most common space heating fuel in every region except the South, where electric heating is more prevalent. Heating oil is much more common in the Northeast than in other regions, while propane is more common in the Midwest.
Source: U.S. Energy Information Administration, Short-Term Energy Outlook, Winter Fuels Outlook, October 2018
Note: Winter covers the period October 1 through March 31.
Source: U.S. Energy Information Administration, Short-Term Energy Outlook, Winter Fuels Outlook, October 2018
Note: Winter covers the period October 1 through March 31.
Source: U.S. Energy Information Administration, Short-Term Energy Outlook, Winter Fuels Outlook, October 2018
Note: Winter covers the period October 1 through March 31.
Source: U.S. Energy Information Administration, Short-Term Energy Outlook, Winter Fuels Outlook, October 2018
Note: Winter covers the period October 1 through March 31.
Principal contributor: Stacy MacIntyre