
Wind generators’ cost declines reflect technology improvements and siting decisions
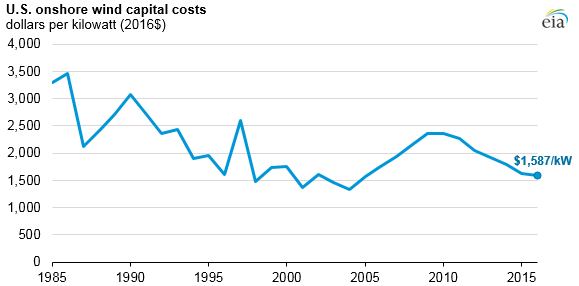
Between 2010 and 2016, the capacity-weighted average cost (real 2016$) of U.S. wind installations declined by one-third, from $2,361 per kilowatt (kW) to $1,587/kW, based on analysis in the U.S. Department of Energy, Office of Energy Efficiency and Renewable Energy’s (DOE/EERE) Wind Technology Market Report. The reasons for this decline include improving technology and manufacturing capability and an increasing concentration of builds in the regions of the United States with the lowest installation costs.
After many years of declining real project costs, wind reached a low in 2004 at $1,342/kW. Through the remainder of that decade, costs gradually increased, reaching a peak in 2009 and 2010 of about $2,360/kW.
Contributing factors to the increasing costs through 2010 included increasing labor costs, an increase in the cost of key manufacturing and construction commodities, and international currency exchange fluctuations affecting imports of key equipment.
After 2010, installed costs began to decline as some of those pressures lifted. The global recession of 2008 reduced the cost of key construction and manufacturing commodities. Domestic manufacturing capacity for wind turbine components increased, and the increasing pace of installations helped to reduce both turbine manufacturing and installation costs through learning-by-doing effects, even as higher-performing equipment continued to enter the wind turbine market.

Regional variations in wind turbine installation costs also have an effect on reported U.S. average costs. In 2010, the Interior region of the United States had an average installation cost of $2,069/kW, compared with $2,247/kW for the rest of the country. By 2016, the costs in the Interior had dropped 25% from 2010 levels to $1,531/kW, and costs in the rest of the United States had dropped 10% to $2,025/kW. EIA began collecting capital cost data for new generators in 2013, and this data closely tracks the estimates from DOE/EERE.
Also in 2010, the share of wind capacity installations was almost evenly split between the Interior and the rest of the United States, with only 46% of capacity entering service that year in the Interior. By 2016, almost 90% of incremental capacity was installed in the lower-cost Interior region. This capacity takes advantage of not only the more favorable wind resources of the region, but also the easily developed expanses of flat land (allowing for larger project sizes) and transportation access to the developing concentration of turbine component manufacturing in this region.
The increasing concentration of U.S. wind builds in the low-cost Interior region of the country has reinforced the overall decline in the average cost of wind construction. Because of the recent increase in the overall capacity mix in this region, the national rate of decline in wind costs closely tracks the cost declines for the Interior. Although other factors have affected overall costs, 2016 average installed costs for wind in the United States would have been more than 10% higher if total wind installations had remained at their 2010 geographic market shares.
Principal contributor: Chris Namovicz
Tags: generation, costs, electricity, renewables, wind