
U.S. households with more vehicles travel more but use additional vehicles less
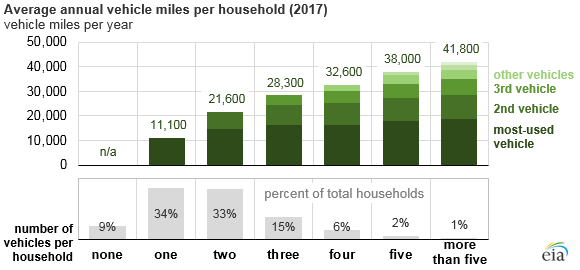
Households in the United States with more vehicles not only travel more, but they often put more miles on their most-used (primary) vehicle compared with households with fewer vehicles, according to the Federal Highway Administration’s National Household Travel Survey (NHTS). Households with just one vehicle drove an average of about 11,100 miles per year, while households with more than five vehicles traveled a total of about 41,800 miles; each additional vehicle within a household had less average use. About two-thirds of households have either one or two vehicles.
U.S. households with more vehicles also tend to drive their primary vehicle more than households with fewer vehicles. While a two-vehicle household travels about 14,600 miles annually with the most-used vehicle, a five- or more vehicle household travels about 18,600 miles annually with the most-used vehicle.
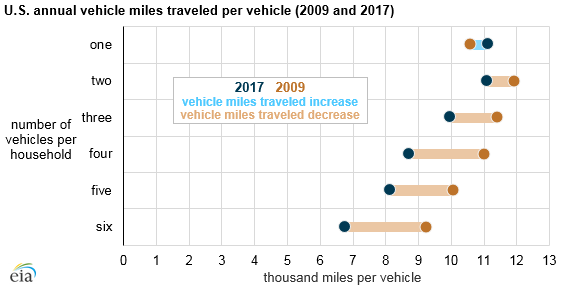
For U.S. households with more than one vehicle, the average use per vehicle within a household is greatest in a two-vehicle home, where the average vehicle travels about 11,000 miles. This average declines as households add more vehicles; a six-vehicle home averages about 6,700 miles per vehicle.
Gasoline consumption by household vehicles depends on both driving behavior (measured by vehicle miles traveled, or VMT) and vehicle fuel economy (measured in miles per gallon). Changes in gasoline prices are typically the primary factor in short-term fluctuations in gasoline expenditures, while changes in VMT and fuel economy (i.e., vehicle purchases) are more likely to influence longer-term trends.
In 2017, the total VMT for household vehicles was 2.11 trillion vehicle miles, down from the 2.25 trillion vehicle miles reported by NHTS for 2009, the previous NHTS survey year. Vehicle travel in households with only one vehicle increased from 2009 to 2017, which was the only category to do so.
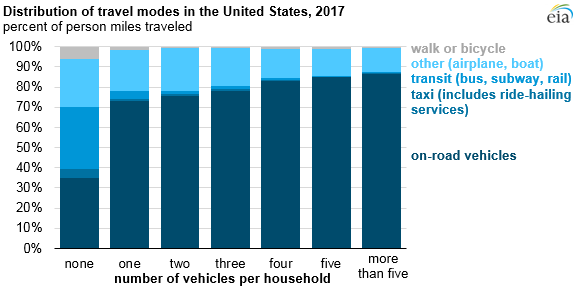
People in households in the United States without vehicles may still have access to vehicle travel or travel by other modes. Based on annualized person miles traveled, on average, a person in a zero-vehicle household uses transit modes such as bus, subway, and rail about eight times more than households with one or more vehicles. Similarly, these same zero-vehicle households take greater advantage of taxis and non-motorized modes of travel such as walking or biking.
The NHTS has been conducted by the U.S. Department of Transportation's Federal Highway Administration eight times since 1969. The latest data year for this survey is 2017, a year with relatively low gasoline prices, which tends to increase vehicle travel.
Principal contributor: Mark Schipper
Tags: residential, transportation, vehicles