
Average frequency and duration of electric distribution outages vary by states
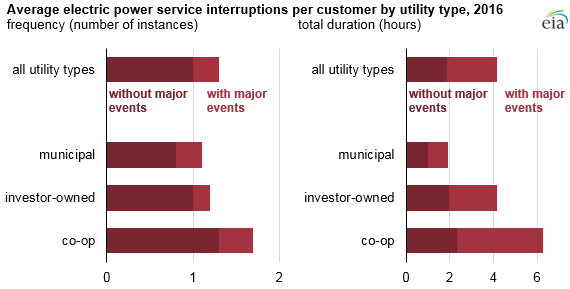
Interruptions in electricity service vary by frequency and duration across the many electric distribution systems that serve about 145 million customers in the United States. In 2016, customers experienced an average of 1.3 interruptions and went without power for four hours during the year. Although some distribution customers have backup generators that provide auxiliary power, most customers are without electricity when outages occur.
The reliability of electricity supply systems is generally measured using two metrics that show the duration and frequency of outages: System Average Interruption Duration Index (SAIDI) and System Average Interruption Frequency Index (SAIFI). Many of the standards in reporting these metrics were initially developed by the Institute of Electrical and Electronics Engineers (IEEE), an international, professional trade association for electrical and computer information technologies, engineering, and related fields.
Outage frequency and duration values are reported to EIA for any interruption lasting longer than five minutes. Utilities may designate if these outages occurred during major events, which can include snowstorms, hurricanes, floods, or heatwaves. Utilities can also designate periods of outages that differ greatly from its five-year history as a major event.
EIA collects data on the frequency and duration of outages for three broad categories of distribution utilities: investor-owned utilities (IOU), owned by shareholders; cooperative energy utilities (co-ops), owned by members; and municipals, owned by cities. In 2016, utilities in these three groups that reported their outage information to EIA collectively made up only 34% of all utilities but accounted for about 91% of electricity sales.
Municipal utility customers experienced the lowest instances of power outages in both frequency and duration, averaging one outage and less than two hours of interrupted electric service in 2016. Investor-owned utilities' customers averaged about four hours without electric service, while co-op customers averaged about six hours without electric service.
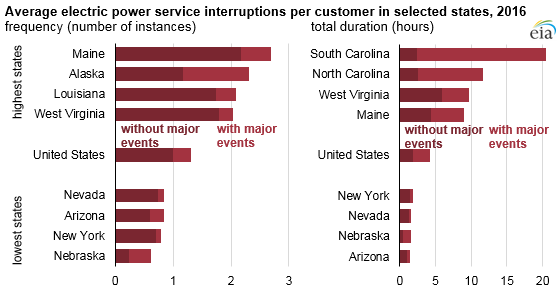
In 2016, when major events are excluded, the average U.S. electricity customer was without power for 112 minutes and experienced one outage. When major events are included, the numbers increase by 138 minutes without power and 0.3 outage occurrences to a total of 250 minutes and 1.3 outages.
Excluding major events, the average electricity customer outage durations in 2016 ranged from 27 minutes in Nebraska to 6 hours in West Virginia. When major events are included, Hurricane Matthew caused South Carolina’s power outage duration to be the highest in the nation for 2016, averaging more than 20 hours per customer.
Principal contributors: Anodyne Lindstrom, Sara Hoff
Tags: electricity, outages