
EIA uses two simplified metrics to show future power plants’ relative economics
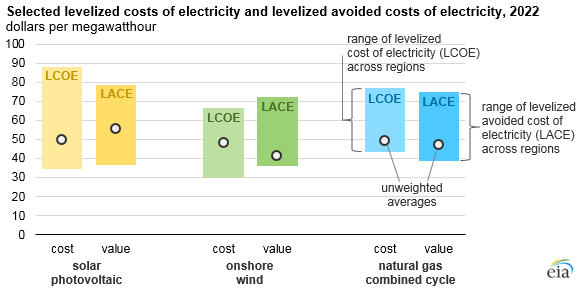
EIA’s long-term outlook for the electric power sector considers both the cost to build and operate power plants as well as the value those plants provide to the grid. A supplemental report to EIA’s Annual Energy Outlook 2018 (AEO2018) describes two simple measures of cost and value to show how certain technologies can be compared to determine the most economically attractive technologies, and in turn, the types of power plants most likely to be built.
EIA calculates two measures that, when used together, largely explain the economic competitiveness of electricity generating technologies.
The levelized cost of electricity (LCOE) represents the installed capital costs and ongoing operating costs of a power plant, converted to a level stream of payments over the plant’s assumed financial lifetime. Installed capital costs include construction costs, financing costs, tax credits, and other plant-related subsidies or taxes. Ongoing costs include the cost of the generating fuel (for power plants that consume fuel), expected maintenance costs, and other related taxes or subsidies based on the operation of the plant.
The levelized avoided cost of electricity (LACE) represents that power plant’s value to the grid. A generator’s avoided cost reflects the costs that would be incurred to provide the electricity displaced by a new generation project as an estimate of the revenue available to the plant. As with LCOE, these revenues are converted to a level stream of payments over the plant’s assumed financial lifetime.
Power plants are considered economically attractive when their projected LACE (value) exceeds their projected LCOE (cost). Both LCOE and LACE are levelized over the expected electricity generation during the lifetime of the plant, resulting in values presented in dollars per megawatthour. These values range across geography, as resource availability, fuel costs, and other factors often differ by market. LCOE and LACE values also change over time as technology improves, tax credits and other taxes or subsidies expire, and fuel costs change.
The relative difference between LCOE and LACE is a better indicator of economic competitiveness than either metric alone. A comparison of only LCOE across technology types fails to capture the differences in value provided by different types of generators to the grid.
Some power plants can be dispatched, while some—such as those powered by the wind or solar—operate only when resources are available. Some power plants provide electricity during parts of the day or year when power prices are higher, while others may produce electricity during times of relatively low power prices.
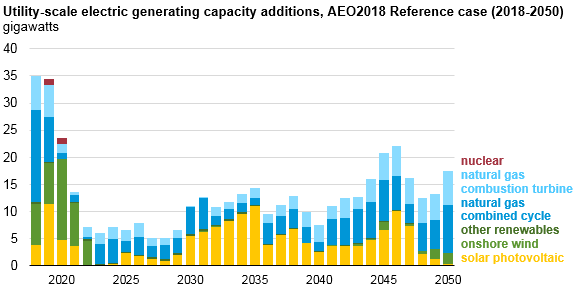
In AEO2018, most of the capacity additions through 2050 come from three technologies: solar photovoltaic (PV), onshore wind, and natural gas combined cycle, which together make up 77% of all projected capacity additions from 2018 through 2050.
LCOE and LACE reduce economic competition to a few easily understood factors such as generic technology costs and primary revenue streams under standardized operating assumptions. The decision to build new capacity in the real world, and as modeled in the Annual Energy Outlook, depends on these factors as well as other considerations.
Factors such as inherent uncertainty about future fuel prices, compliance with regulations and policies, inter-regional electricity trade, site- or region-specific operational considerations, and maintaining system reliability may lead developers to prioritize portfolio diversification or otherwise build plants that do not meet this simplified economic test.
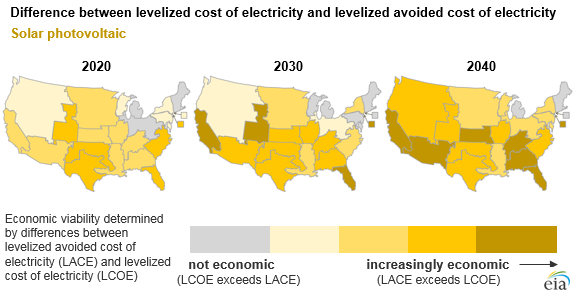
Solar PV’s economic competitiveness is relatively high through 2022 as federal tax credits reduce PV’s LCOE. As those tax credits are phased out, technology costs are expected to have declined to the point where solar PV remains economically competitive in most parts of the country. Because solar PV provides electricity during the middle of the day, when electricity prices are relatively high, solar PV’s value to the grid (i.e., LACE) tends to be higher than other technologies.
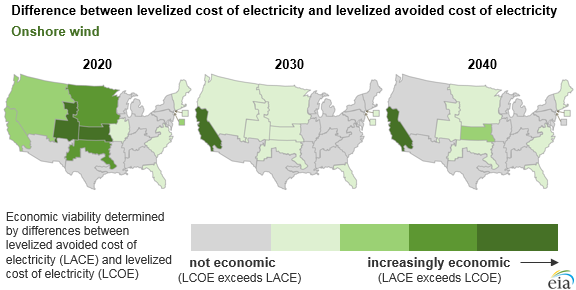
Onshore wind also sees higher economic competiveness in the earlier part of the projection, prior to the expiration of federal tax credits in 2020. Over time, wind remains competitive in the Plains states, where wind resources are highest. Wind’s LACE is relatively low in most areas, as wind output tends to be highest at times when power prices are low.
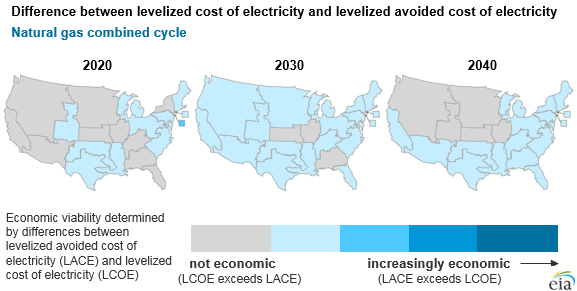
Natural gas combined-cycle generators’ overall LCOE increases over time as natural gas prices increase, diminishing its economic competiveness. Natural gas combined-cycle generation may remain competitive in regions with low natural gas prices or in regions where installing more economically attractive technologies is not feasible.
More information about LCOE, LACE, and economic competitiveness of electricity generating technologies is available in EIA’s Levelized Cost and Levelized Avoided Cost of New Generation Resources in the Annual Energy Outlook 2018 report.
Principal contributor: Manussawee Sukunta
Tags: AEO2018, electricity, natural gas, power plants, solar, wind