
Summer 2011 electricity prices were mostly down compared to summer 2010

Except for Texas, California, and the Southwest, average on-peak, wholesale electricity prices at trading points across much of the country declined during the summer (May 15 to September 15) of 2011 when compared to the summer of 2010. Wholesale power prices generally mirrored changes in wholesale natural gas prices. One stark exception was in the system operated by the Electric Reliability Council of Texas (ERCOT) where extreme, sustained, widespread heat as well as insufficient capacity resulted in wholesale prices over 100% higher compared to the summer of 2010.
Electric system demand typically increases in the summer months as a result of residential air-conditioning demand. This increased demand usually drives up wholesale electricity prices compared to the spring and fall.
Some key drivers of price changes this summer included:
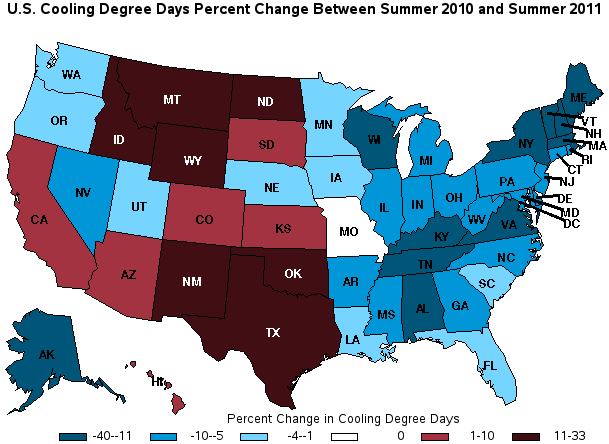
Weather: Mild temperatures throughout the Northeast and Central United States drove significant declines in average power prices in New England, New York, and the Midwest. The sustained heat wave in Texas resulted in record-breaking load levels. The map below shows the percentage change in cooling degree-days between the summer of 2010 and the summer of 2011, by state. Texas had a 13% increase in cooling degree-days, while Oklahoma and New Mexico had 15% and 13% increases, respectively. August 2011 was the warmest August recorded by the National Oceanic and Atmospheric Administration for New Mexico, Oklahoma, Colorado, Arizona and Louisiana.
Natural Gas Prices: Because natural gas is the marginal fuel for electricity generation in many regions of the country, natural gas prices can have a significant impact on the wholesale price of electricity. Overall, wholesale natural gas prices this summer were little changed compared to prices in the summer of 2010; wholesale natural gas prices at the Henry Hub in Louisiana fell about 1% to $4.30 per million British thermal units. There were some regional changes, however. In the Northeast, wholesale natural gas prices were down between 2% and 15%, reflecting both lower regional demands and growing natural gas production from the Marcellus shale play. Natural gas prices were about 4-7% higher than last summer in the Southwest and California markets and supported modestly higher wholesale power prices in those markets.
Hydroelectric Output: Power prices in the Pacific Northwest were driven down by the availability of inexpensive hydroelectric generation and mild temperatures in the early part of the summer. The average on-peak wholesale electricity price at Mid-Columbia zone (along the Washington/Oregon border) decreased 6% as hydroelectric output increased above five-year highs.
Tags: electricity, hydroelectric, natural gas, Oregon, prices, renewables, Washington, weather