
Energy-related carbon dioxide emissions expected to fall in 2017 but rise in 2018
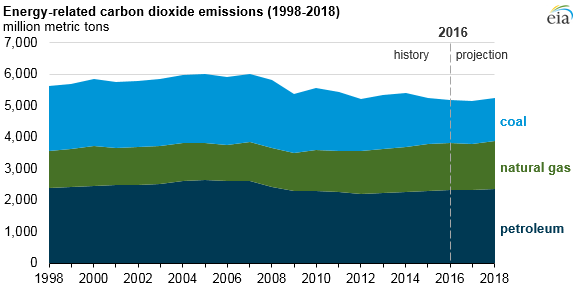
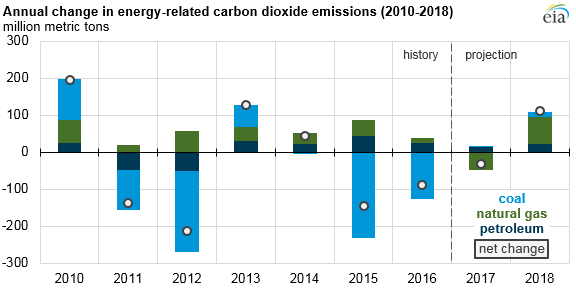
Energy-related carbon dioxide (CO2) emissions fell in both 2015 and 2016, and they are expected to fall again in 2017, based on forecasts in EIA’s Short-Term Energy Outlook. However, EIA forecasts a 2.2% increase in energy-related CO2 emissions in 2018. An annual increase is not without recent precedent; annual emissions rose in 2010, 2013, and 2014, although U.S. energy-related CO2 emissions have generally been declining since reaching their peak in 2007.
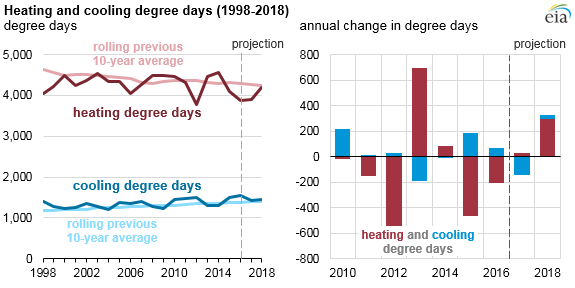
Weather is a key factor in annual changes in energy consumption and the resulting emissions. Weather-related energy demand can be estimated by changes in population-weighted degree days, which reflect deviations from a base temperature of 65 degrees Fahrenheit. Heating degree days estimate the need for heating-related energy demand on colder days, while cooling degree days indicate the need for cooling (air conditioning) on warmer days.
By the end of 2017, annual heating degree days are expected to have been higher than in 2016, and cooling degree days are expected to have been lower. EIA’s short-term projections for heating and cooling degree days largely reflect a return to normal temperatures, based on the average of the previous 10 years. Consequently, in 2018, both heating and cooling demand are expected to increase, by 7.5% and 2.4%, respectively.
These increases are expected to drive more energy consumption for heating—fueled by natural gas, electricity, and other fuels—and more energy consumption for air conditioning—fueled mostly by electricity. Because about 63% of the electricity generated in the United States is from coal and natural gas, increases in electricity consumption also mean more emissions from coal and natural gas power plants.
In 2018, energy-related CO2 emissions are expected to increase for each fossil fuel—petroleum, natural gas, and coal—for a total increase of 111 million metric tons. The most recent year with emissions increases in all three fossil fuels was 2013, when emissions rose by 128 million metric tons from the previous year.
Weather also plays a role in power generation from certain fuels. After two years of higher-than-average levels of precipitation in some areas, hydropower generation is projected to decrease in 2018 by 30 billion kilowatthours (kWh). Beyond hydro, increases in other renewable and nuclear generation (20 billion kWh and 4 billion kWh, respectively) are not enough to offset the expected hydropower decrease, leading non-carbon electricity generation to decline by 5 billion kWh. If realized, this would be the first annual decline in electricity generation from non-carbon sources since 2012.
Because total power generation is expected to increase in 2018, electricity generation from coal- and natural gas-fired sources is projected to increase by a combined 97 billion kWh. The resulting increase in coal and natural gas CO2 emissions in the power sector—28 million and 29 million metric tons, respectively—combined accounts for 52% of the total projected increase in energy-related emissions in 2018.
Principal contributor: Perry Lindstrom