
Warm weather leads to first recorded natural gas storage injection in February
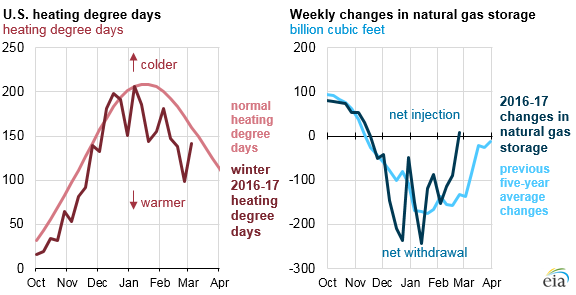
Warmer than normal weather throughout much of the United States resulted in the first recorded net natural gas injection during a week in February since weekly storage data has been collected. For the week ending February 24, the amount of natural gas in storage in the Lower 48 states increased 7 billion cubic feet (Bcf). While some weeks during March in previous years had recorded injections, net injections of natural gas into storage do not typically occur until at least April.
Weekly changes in natural gas storage reflect changes in natural gas consumption, production, and, to a lesser extent, trade. Natural gas consumption is particularly sensitive to fluctuations in weather. Not only is natural gas consumed directly by furnaces and boilers in homes and businesses for heating, but natural gas is also used to generate electricity, which then fuels electric heat pumps and radiant heaters.
Temperatures throughout much of the United States have been higher than normal for many weeks this winter. Heating degree days are a standard index of heating needs that are calculated based on deviations relative to a base temperature of 65 degrees Fahrenheit, and higher numbers of heating degree days reflect colder weather. For the week ending February 25, there were only 98 population-weighted heating degree days for the United States as a whole—a level more typical of mid-April weather. Based on normal weather data for 1971–2000, heating degree days would normally be near 172 for the week ending February 25. Temperatures were especially warm in the Northeast and Midwest, where natural gas heating is common.
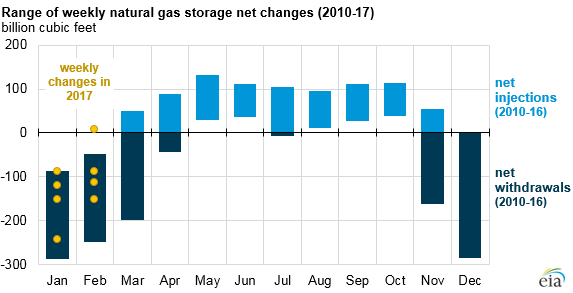
The net injection of 7 Bcf during the week ending February 24, 2017, was extremely rare. Based on data from 2010–16, weekly changes during the month of February ranged from a net withdrawal of 48 Bcf to a net withdrawal of 243 Bcf. Previously, the earliest net injection of the calendar year occurred during the week ending March 16, 2012.
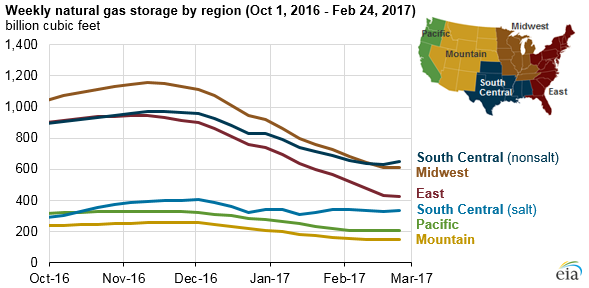
In the week ending February 24, natural gas injections in the South Central region offset unseasonably low withdrawals in other regions. In EIA’s Weekly Natural Gas Storage Report, the South Central region is split into salt and nonsalt (depleted reservoir) facilities. The amount of natural gas stored in South Central nonsalt facilities increased by 16 Bcf and in South Central salt facilities by 5 Bcf. After that injection, natural gas storage levels totaled 2,363 Bcf, or about 300 Bcf more than the previous five-year average for that week (2012–16). EIA’s latest Short-Term Energy Outlook expects natural gas storage levels to fall to 2,121 Bcf by the end of March, or about 335 Bcf higher than the previous five-year average.
Principal contributor: Owen Comstock
Tags: natural gas, storage, weather