
Projected electricity generation mix is sensitive to policies, natural gas prices
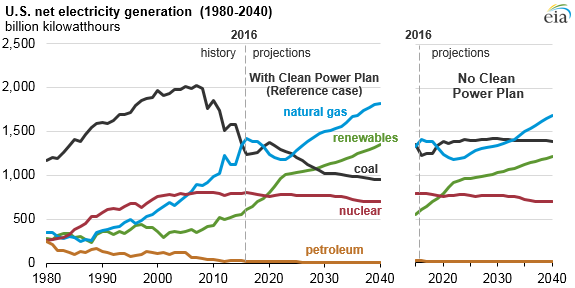
The mix of fuels used to generate electricity in the United States has changed in response to differences in the expected cost of fuels and electricity-generating technology costs and their deployment. These factors, together with policies affecting emissions from power generation, will determine the generation fuel mix of the future.
Multiple cases in EIA’s Annual Energy Outlook 2017 (AEO2017) show how projected electricity generation is affected by fuel prices, especially natural gas prices, and the Clean Power Plan, a final Environmental Protection Agency rule issued in 2015 whose enforcement was stayed by the U.S. Supreme Court in February 2016 pending the resolution of legal challenges.
Without the Clean Power Plan, there is less incentive to switch from carbon-intensive coal to less carbon-intensive natural gas or carbon-free fuels such as wind and solar. In the scenario where the Clean Power Plan is not implemented, coal again becomes the leading source of electricity generation by 2019 and retains that position through 2032, longer than in the Reference case, which includes the Clean Power Plan. Electricity generation from renewable sources remains below coal-fired electricity generation through 2040. Fewer coal plants are retired, and as a result, natural gas and renewable capacity additions are lower compared with the Reference case.
In addition to environmental regulations, the price of natural gas is an important factor in decisions about the operation, retirement, and expansion of electricity generation capacity. Of the cases included in the AEO2017, natural gas prices are lowest in the High Oil and Gas Resource and Technology case. In this case, prices remain close to their current levels through 2040, as lower extraction costs and higher resource availability result in more natural gas production. Conversely, the Low Oil and Gas Resource and Technology case assumes the opposite, and by 2040, natural gas prices return to the relatively high levels of the mid-2000s.
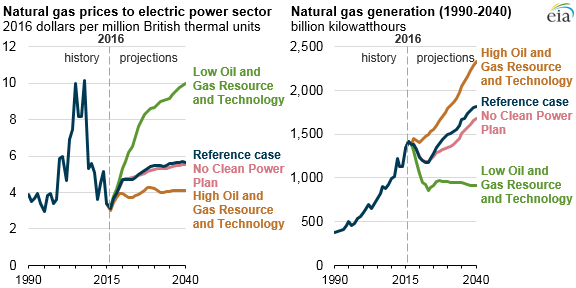
With more optimistic assumptions for natural gas supply that result in lower natural gas prices, the High Oil and Gas Resource and Technology case has more natural gas-fired electricity, displacing both coal-fired and renewable generation. Compared with the Reference case, more coal plants retire or switch to natural gas and less renewable capacity is built.
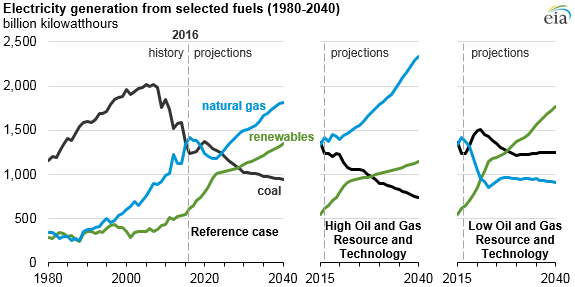
Conversely, higher natural gas prices in the Low Oil and Gas Resource and Technology case result in more electricity generation from both coal-fired and renewable plants, and coal-fired generation exceeds natural gas-fired generation through 2040. Because of higher coal-fired generation and lower natural gas-fired generation, more zero-carbon generation is required to comply with the Clean Power Plan, which is included in the Reference case that is the starting point for both Oil and Gas Resource and Technology cases. Renewables gain market share, surpassing natural gas in 2022 and surpassing coal in 2028. The Low Oil and Gas Resource and Technology case is the only scenario in AEO2017 that results in new nuclear capacity beyond what is currently under construction.
Principal contributor: Jeff Jones
Tags: AEO2017, electricity, environment, generation, natural gas, prices, resources