
Energy-related CO2 emissions for first six months of 2016 are lowest since 1991
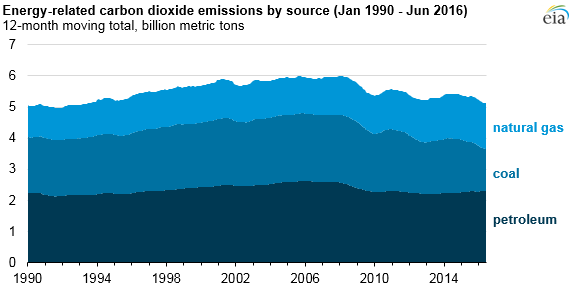
U.S. energy-related carbon dioxide (CO2) emissions totaled 2,530 million metric tons in the first six months of 2016. This was the lowest emissions level for the first six months of the year since 1991, as mild weather and changes in the fuels used to generate electricity contributed to the decline in energy-related emissions. EIA’s Short-Term Energy Outlook projects that energy-associated CO2 emissions will fall to 5,179 million metric tons in 2016, the lowest annual level since 1992.
Mild weather. In the first six months of 2016, the United States had the fewest heating degree days (an indicator of heating demand) since at least 1949, the earliest year for which EIA has monthly data for all 50 states. Warmer weather during winter months reduces demand for heating fuels such as natural gas, distillate heating oil, and electricity. Overall, total primary energy consumption was 2% lower compared with the first six months of 2015. The decrease was most notable in the residential and electric power sectors, where primary energy consumption decreased 9% and 3%, respectively.
Changing fossil fuel consumption mix. Coal and natural gas consumption each decreased compared to the first six months of 2015. However, the decrease was greater for coal, which generates more carbon emissions when burned than natural gas. Coal consumption fell 18%, while natural gas consumption fell 1%. These declines more than offset a 1% increase in total petroleum consumption, which rose during that period as a result of low gasoline prices.
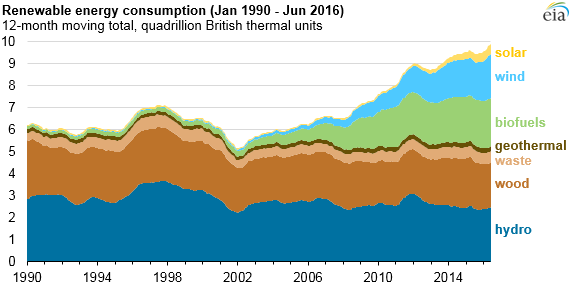
Increasing renewable energy consumption. Consumption of renewable fuels that do not produce carbon dioxide increased 9% during the first six months of 2016 compared with the same period in 2015. Wind energy, which saw the largest electricity generating capacity additions of any fuel in 2015, accounted for nearly half the increase. Hydroelectric power, which has increased with the easing of drought conditions on the West Coast, accounted for 35% of the increase in consumption of renewable energy. Solar energy accounted for 13% of the increase and is expected to see the largest capacity additions of any fuel in 2016.
Principal contributor: Allen McFarland
Tags: CO2 (carbon dioxide), coal, electricity, emissions, generation, hydroelectric, natural gas, solar, wind