
Monthly U.S. renewable electricity generation in 2016 surpasses previous years
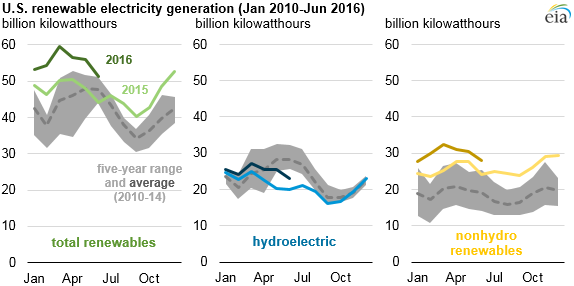
Renewable electricity generation has surpassed levels from previous years in every month so far this year, based on data through June. Both hydroelectric and nonhydroelectric renewables have contributed to this trend, but in different ways. After a lengthy West Coast drought, hydro generation has increased and is now closer to historical levels. Nonhydro renewable generation continues to increase year-over-year and has exceeded hydro generation in each month since February 2016.
Renewable electricity sources include both conventional hydro and nonhydro sources such as wind, geothermal, biomass, and solar. The data shown here represent generation from only utility-scale facilities whose capacity exceeds 1 megawatt (MW) as well as distributed solar photovoltaic (PV) capacity (i.e., rooftop solar), another source of nonhydro renewables. Hydro and wind facilities under 1 MW, which are not included here, would contribute a small amount of generation, but they are much less common than small PV systems.
Annual hydro generation in 2015 was at the lowest level since 2007, largely because of drought conditions in the Pacific Coast states. The three continental Pacific Coast states (California, Oregon, and Washington) contain 50% of total U.S. conventional hydro capacity. The drought was so severe that in 2015, California enacted its first-ever mandatory water restrictions. The region's water situation appears to have somewhat improved in 2016 with increased precipitation from the El Niño weather pattern helping to fill reservoirs, especially in Washington and Northern California.
Nonhydro renewable generation has been steadily increasing over recent years as more capacity has been installed, especially wind and solar PV. In 2013, the total annual generation from nonhydro renewable sources surpassed hydro generation for the first time. Nonhydro renewable sources (including distributed generation from rooftop PV) collectively exceeded 10% of the monthly electricity generation mix for the first time this March and again in April. Because of the moderate weather in these months, March and April typically have relatively low electricity demand.
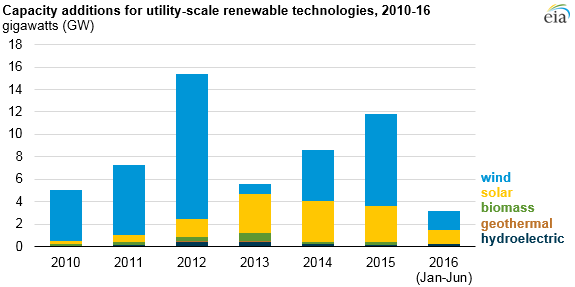
Capacity additions for nonhydro renewables have collectively accounted for most of the electric capacity additions over the past three years in the United States. Capital costs of solar and wind facilities have declined considerably in recent years. Other factors in the growth of nonhydro renewable capacity include policy-based incentives, such as state renewable portfolio standards and tax credits. Key tax credits such as the production tax credit and the investment tax credit have generally been in effect over the past several years and were extended in December 2015.
Principal contributor: Michelle Bowman
Tags: capacity, electricity, generation, hydroelectric, renewables, solar, wind