
Natural gas flaring in North Dakota has declined sharply since 2014
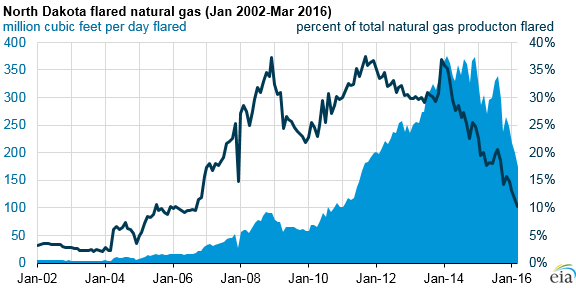
The volume of North Dakota's natural gas production that is flared has fallen sharply in both absolute and percentage terms since 2014. In March 2016, 10% of North Dakota's total natural gas production was flared, less than one-third of the January 2014 flaring rate, which was at 36%. Flaring rates and volumes have significantly decreased as North Dakota's total natural gas production has continued to grow, setting a monthly total natural gas production record of 1.71 billion cubic feet per day in March 2016. The North Dakota Industrial Commission established targets in September 2015 to reduce natural gas flaring.
Natural gas is flared (burned) rather than vented (released into the air) without combustion for both safety and environmental reasons. Vented, unprocessed natural gas contains hydrocarbons that are heavier than air, such as propane and butane, which can be hazardous if ignited. Methane, the primary component of natural gas, is also a potent greenhouse gas. Flaring natural gas produces carbon dioxide, which, while also a greenhouse gas, has a much lower global warming potential (a measure of how various gases can affect the atmosphere's radiative balance) than methane.
Natural gas flaring in the United States is not confined to North Dakota, but since 2012, North Dakota has had the highest volumes of flared natural gas. By law, North Dakota prohibits natural gas venting.
Most North Dakota oil and natural gas production is in the Bakken formation, a relatively new production area that has lacked sufficient natural gas pipeline infrastructure. As new infrastructure has been built, more of the Bakken region's natural gas production has been brought to market, reducing the volume of flared natural gas despite much higher production.
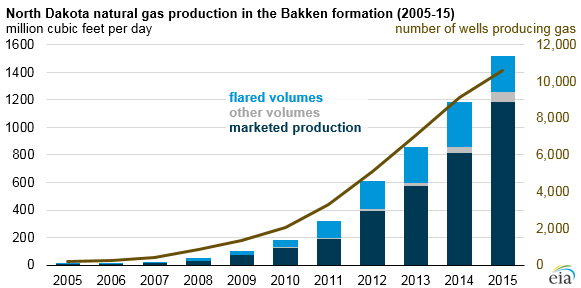
Note: Data include Bakken wells producing natural gas. Wells do not exclusively produce natural gas, but include other volumes such as volumes used on the lease, volumes stored, volumes used to repressure the wells, and natural gas plant liquids production.
New wells account for a large share of the volume of North Dakota's flared natural gas. North Dakota oil and gas regulations require that tax and royalties be paid for all natural gas flaring beyond a well's first year of production. The North Dakota Department of Mineral Resources can grant confidential reporting status to wells for the first six months of a well's production. These wells, which are also known as confidential wells, have nearly double the flaring rates of nonconfidential wells.
Based on data for the 12 months from April 2015 through March 2016, 29% of the natural gas produced by confidential wells in North Dakota was flared, while 15% of the natural gas from nonconfidential wells was flared. Once a well's first year of production ends, operators must cap the well, connect it to a natural gas gathering line, equip the well with an electrical generator that consumes at least 75% of the natural gas from the well, or find another approved approach that reduces flaring.
The North Dakota Industrial Commission first established targets for the percentage of natural gas flared in April 2014 and subsequently revised these targets in September 2015. Currently, the targets allow a maximum of 23% of production volumes to be flared through the first quarter of 2016, 20% for April through October 2016, 15% for November 2016 through October 2018, and 12% for November 2018 through October 2020. Ultimately, the target falls to 9% of production beginning November 1, 2020.
Principal contributor: Neal Davis
Tags: natural gas, North Dakota, states