
Wells drilled since start of 2014 provided nearly half of Lower 48 oil production in 2015
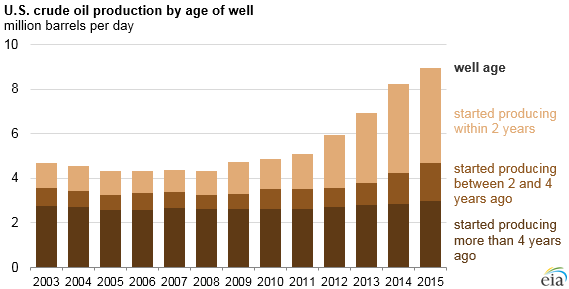
Note: Well age reflects the difference between the calendar year and the year the well started producing.
U.S. crude oil production from the Lower 48 states from new wells (drilled since the start of 2014) made up 48% of total U.S. crude oil production in 2015, up from 22% in 2007. Production from new wells has grown as advances in horizontal drilling and completion techniques led to growth in oil production from low-permeability tight reservoirs. In 2015, production from tight formations—which include, but are not limited to, shale plays—accounted for more than 4 million barrels per day (b/d), or 50% of total U.S. oil production.
U.S. oil production from tight formations increased from 0.5 million b/d in 2009 to 4.6 million b/d in May 2015, at which point decreasing oil prices contributed to declines in oil production. As of December 2015, oil production from tight formations was 8% lower than the level in May. More than 80% of oil production from tight formations originates from the Eagle Ford, Bakken, and Permian regions.
Horizontal wells drilled into tight formations tend to have very high initial production rates, but they also have steep initial decline rates. With steep decline rates, constant drilling and development of new wells is necessary to maintain or increase production levels. Rig counts and the productivity of newly drilled wells, which are tracked in EIA's Drilling Productivity Report, are two key indicators of future oil production. Future production can also be affected by the current inventory of drilled but not yet completed wells and the potential for recompleting and refracturing existing wells that may increase production from already-producing wells without drilling new wells. The U.S. oil-directed rig count totaled nearly 1,600 rigs in the fall of 2014. However, the decline in oil prices over the past 18 months has reduced drilling activity, with just 413 rigs operating as of February 19, 2016.
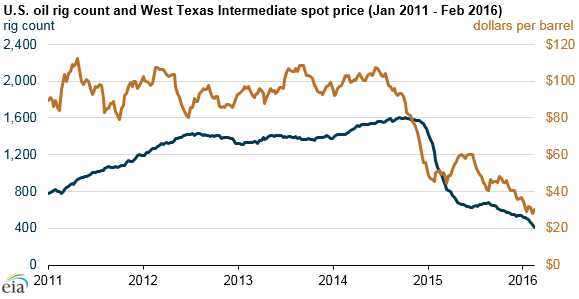
Low oil prices and reduced capital expenditure for drilling new wells have been reflected in declining crude oil production in the United States since May 2015, despite the continuing increase in initial production rates of the new wells that were still being drilled and completed. Oil production from new wells has so far been able to keep U.S. crude oil production from falling significantly below its level in late 2014. However, EIA's Short-Term Energy Outlook projects that U.S. oil production will decline over the next two years, falling to 8.7 million b/d in 2016 and to 8.2 million b/d in 2017.
Principal contributors: EIA Staff
Tags: Bakken, crude oil, drilling, Eagle Ford, liquid fuels, production/supply, shale, tight oil