
Iraq is second-leading contributor to global liquids supply growth in 2015

Note: The estimates include crude oil, lease condensate, natural gas liquids, biofuels, coal-to-liquids, gas-to-liquids, and refinery processing gain.
Iraq was the second-leading contributor to the growth in global oil supply in 2015, behind only the United States. Crude oil production in Iraq, including fields in the Kurdistan Region of northern Iraq, averaged 4.0 million barrels per day (b/d) in 2015, almost 700,000 b/d above the 2014 level. Iraq is the second-largest oil producer in the Organization of the Petroleum Exporting Countries (OPEC) and accounted for about 75% of total OPEC production growth in 2015. Iraq's oil consumption decreased slightly in 2015, and as a result, all of the crude oil production increase was exported to international markets.
In southern Iraq, where almost 90% of the country's oil was produced in 2015, the upgrade of midstream infrastructure (pipeline pumping stations and storage facilities) and improvements to crude oil quality contributed to increased production. In June 2015, Iraq started marketing Basra Heavy grade crude oil, distinguishing it from the Basra crude it had traditionally marketed as a light crude oil. Before this distinction, Iraq limited its production at oil fields producing heavy oils to maintain the minimum standard for the light grade Basra crude oil. Once Iraq began marketing Basra heavy separately from Basra light, it was able to increase production at fields producing the heavier oil and improve the quality of Basra light. In northern Iraq, where the remaining 10% of Iraq's oil was produced in 2015, the Kurdistan Regional Government (KRG) increased the capacity of its independent pipeline, allowing output increases.
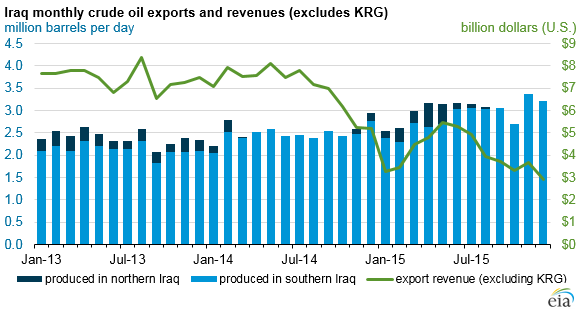
Despite the record level of production and exports, the Iraqi government has asked international oil companies (IOCs) to reduce spending plans at southern oil fields in 2016 because Iraq has been struggling to keep up its share of payments to IOCs. In 2015, Iraq (excluding KRG) earned slightly more than $49 billion dollars in crude oil export revenue, $35 billion dollars less than the previous year, despite a substantial increase in export volumes. The shortfall in revenue has posed a significant economic challenge, as crude oil export revenue accounted for 93% of Iraq's total government revenue in 2014, according to the International Monetary Fund. EIA expects Iraq's production growth to slow in 2016 because of constraints arising from reduced export revenue.
The Iraqi Oil Ministry publishes monthly data on exports and revenues. On average, Iraqi crude typically sells $5/b to $10/b less than Brent, a global crude oil price benchmark. The KRG does not publish its official selling price, though crude marketed by the KRG is typically sold at a lower price than the rest of Iraq. The KRG is also experiencing budgetary constraints that are causing payment delays to IOCs, which will likely contribute to slowing production growth this year.
Because northern Iraq is landlocked, oil produced there is transported through a KRG-owned pipeline for export through the Ceyhan port in Turkey. The KRG started transferring a portion of the oil produced in the north to the federal government of Iraq (Baghdad) at Ceyhan in late 2014 after the two governments signed a deal on outstanding budgetary and revenue issues. However, both sides were unable to sustain their commitments under the deal, and the KRG has not transferred any oil produced in the north to Baghdad since August 2015, as represented in the chart below.
Principal contributor: Asmeret Asghedom