
Gasoline product supplied may reflect snowstorm effects on driving
Source: U.S. Energy Information Administration - Weekly Petroleum Status Report
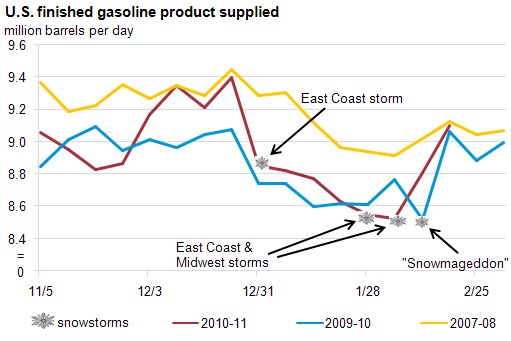
Several large snowstorms have kept drivers off the roads in New England, the Mid-Atlantic, and the Midwest this winter, and may have been reflected in EIA's gasoline product supplied data.
Although weekly product supplied estimates can show swings due to timing and reporting issues, they can be useful to track the effects of weather when trying to interpret weekly data trends that may not reflect the underlying level of demand.
Gasoline demand typically is lower in January than in December, but then begins to climb again in February. A large East Coast snowstorm on December 28 crippled post-holiday traffic, which coincided with a half-million barrel per day drop in gasoline demand for the week ending December 31. The East Coast and Midwest continued to see snow fall regularly throughout the month of January, but another large storm at the end of the month again disrupted road travel in the Northeast and actually closed several Mid-Atlantic product terminals due to heavy snow and power outages.
The following week, another large storm system in the Midwest and East Coast affected about one-third of the U.S. population. Gasoline demand for the weeks ending January 28 and February 4 averaged about 8.5 million barrels per day, below last-year levels despite gasoline demand running about 2.8% higher than year-ago levels during the month of December. The large dip in gasoline product supplied for the week ending February 12, 2010 coincided with two large East Coast storms that occurred last winter on February 5-6 and February 9-10.
Unlike a delayed shipment that will eventually show up in supply data, driving that does not take place due to poor road conditions is demand that is lost forever. In fact, unused barrels often show up as increases in inventories, which may have contributed to the large weekly gasoline stock builds seen in January and early February.