
Spread between Henry Hub, Marcellus natural gas prices narrows as pipeline capacity grows
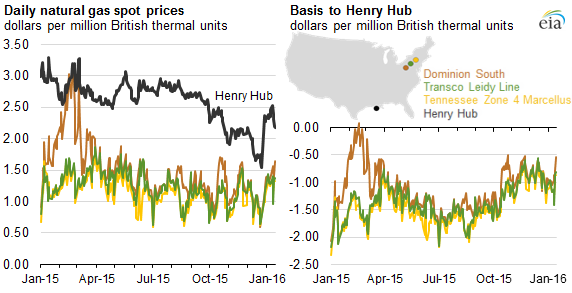
Natural gas spot prices around the United States are often compared to prices at the Henry Hub in Louisiana. At trading points in and around the Marcellus and Utica shale plays in Pennsylvania, West Virginia, and Ohio, natural gas prices consistently trade below the Henry Hub national benchmark price. However, the difference between these pricing points and the Henry Hub has narrowed in recent months as new pipeline projects have come online.
Most of the natural gas produced in the region is consumed in other areas of the country. With limited infrastructure to deliver natural gas to consumers, the Marcellus region can quickly become oversupplied, causing prices within the Marcellus region (especially Pennsylvania) to be discounted. In times of high demand for heating in the winter, natural gas spot prices can rise substantially in market areas such as New York and Boston. New infrastructure projects have come online to alleviate the disconnect between prices in producing and consuming areas around the country.
Although prices in the Marcellus region are still relatively low, trading under $1.50 per million British thermal units (MMBtu), the gap between Marcellus region price points and Henry Hub has narrowed. The price at Transcontinental Pipeline's (Transco) Leidy Hub in central Pennsylvania, for example, averaged 93 cents per MMBtu below the Henry Hub price from December 1 through January 15. In July 2015, this differential was much larger, averaging $1.65/MMBtu for the month.
Bentek Energy noted that the effect of these new pipeline projects was somewhat limited in November and the beginning of December because of a warm beginning to winter. As heating demand increased in late December and into January, natural gas production in the region increased as well, setting records in December and January, likely because producers had access to new takeaway capacity.
In the Marcellus and Utica plays, production has grown rapidly over the past several years, and infrastructure growth has not kept pace. This is partly because pipeline projects are costly and may take several years to bring online. As a result, there is a large backlog of wells that have been drilled but won't produce until there is available infrastructure or until the price of natural gas increases. These wells allow Marcellus production to ramp up quickly when new infrastructure comes online. According to Bentek estimates, from January 1 through January 20, natural gas production in the Northeast (which includes production from the Marcellus and Utica) was 17% higher than during the same period in 2015.
An upcoming Today in Energy article will discuss several new pipeline projects and expansions that have recently begun operation, along with several projects now under development. As these projects and other pipeline expansions come online, the difference between Marcellus region prices and the Henry Hub price should continue to narrow.
Principal contributor: Katie Teller
Tags: Marcellus, natural gas, pipelines, prices